The most dangerous intersections for pedestrians in Bloomington, Indiana
Where are the most dangerous places to cross the street in Bloomington, Indiana?
This report analyzes and visualizes crash data involving pedestrians from 2003-2022.
Summary
Positive Findings
- The top intersection was Kirkwood and Dunn, which is already safer thanks to seasonal bollards.
- College and Walnut crossing downtown also appear in the top five dangerous intersections for pedestrians. These will potentially be safer through the College and Walnut Corridor makeover being studied.
- The data affirms the safety of the B-Line and it's crossing relative to nearby streets.
- While not surprising, it's notably visible that restricting cars within IU effectively eliminates crashes in the interior of campus.
Opportunities for improvement
- Third and Eagleson made the top five most dangerous intersections for pedestrians.
- Kinser and the Bypass was also in the top five. While the B;ypass is a state road, the crash data highlights the safety benefit of prioritizing the multi-use path extension south from the ped bridge over the bypass. That's already in long range plan, but not in the "priority" list.
- The trend of larger, heavier vehicles in US is correlated with a rise in pedestrian fatalities. Some cities are using policies and design to counter this safety risk.
- If the official data was cleaner, future analysis like this would be easier.
Read on for the full report.
Who is walking in Bloomington?
Before we get to the maps, let's look at who is impacted here, literally.
A survey of neighborhood parking permit holders from 2020 found that 42% of respondents walk to work or school.
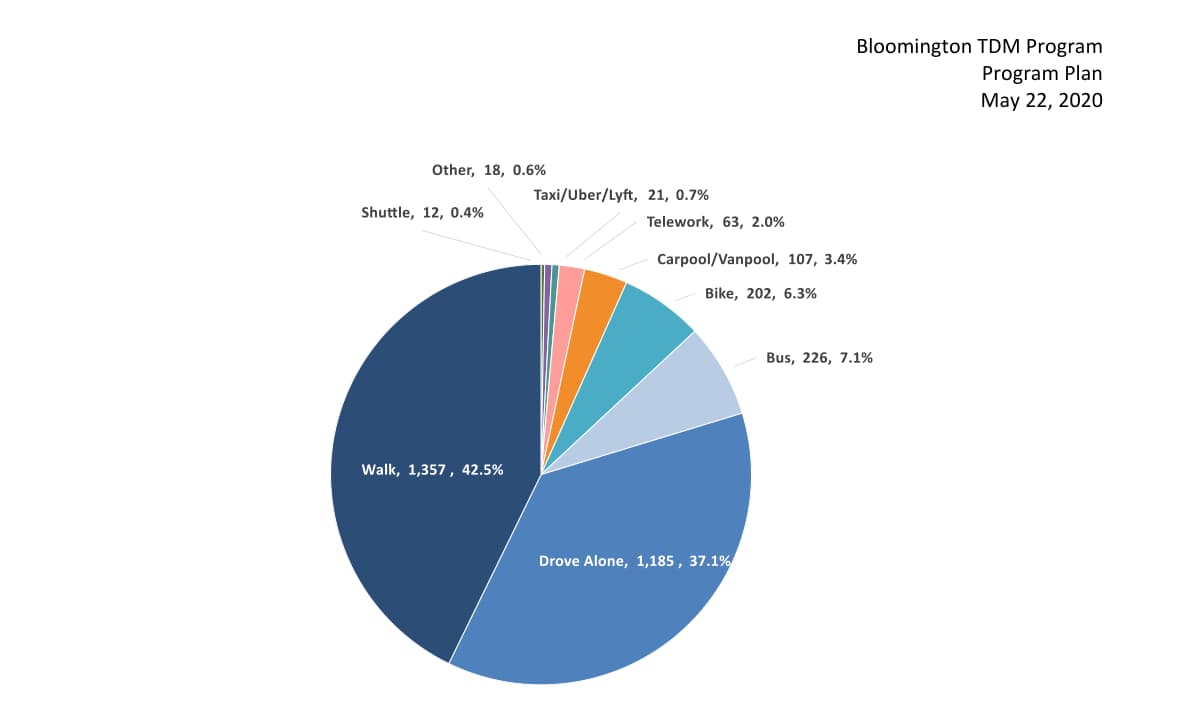
At Indiana University, a 2021 survey found that 39.4% of students don't bring a car to campus and walking is used to get to campus 41% of the time.
In 2022, AAA estimated that the average cost for an American to own a new car is almost $900/month. Walking to school and work is popular now and with the rising cost of owning a car, being able to walk safely will impact many residents.
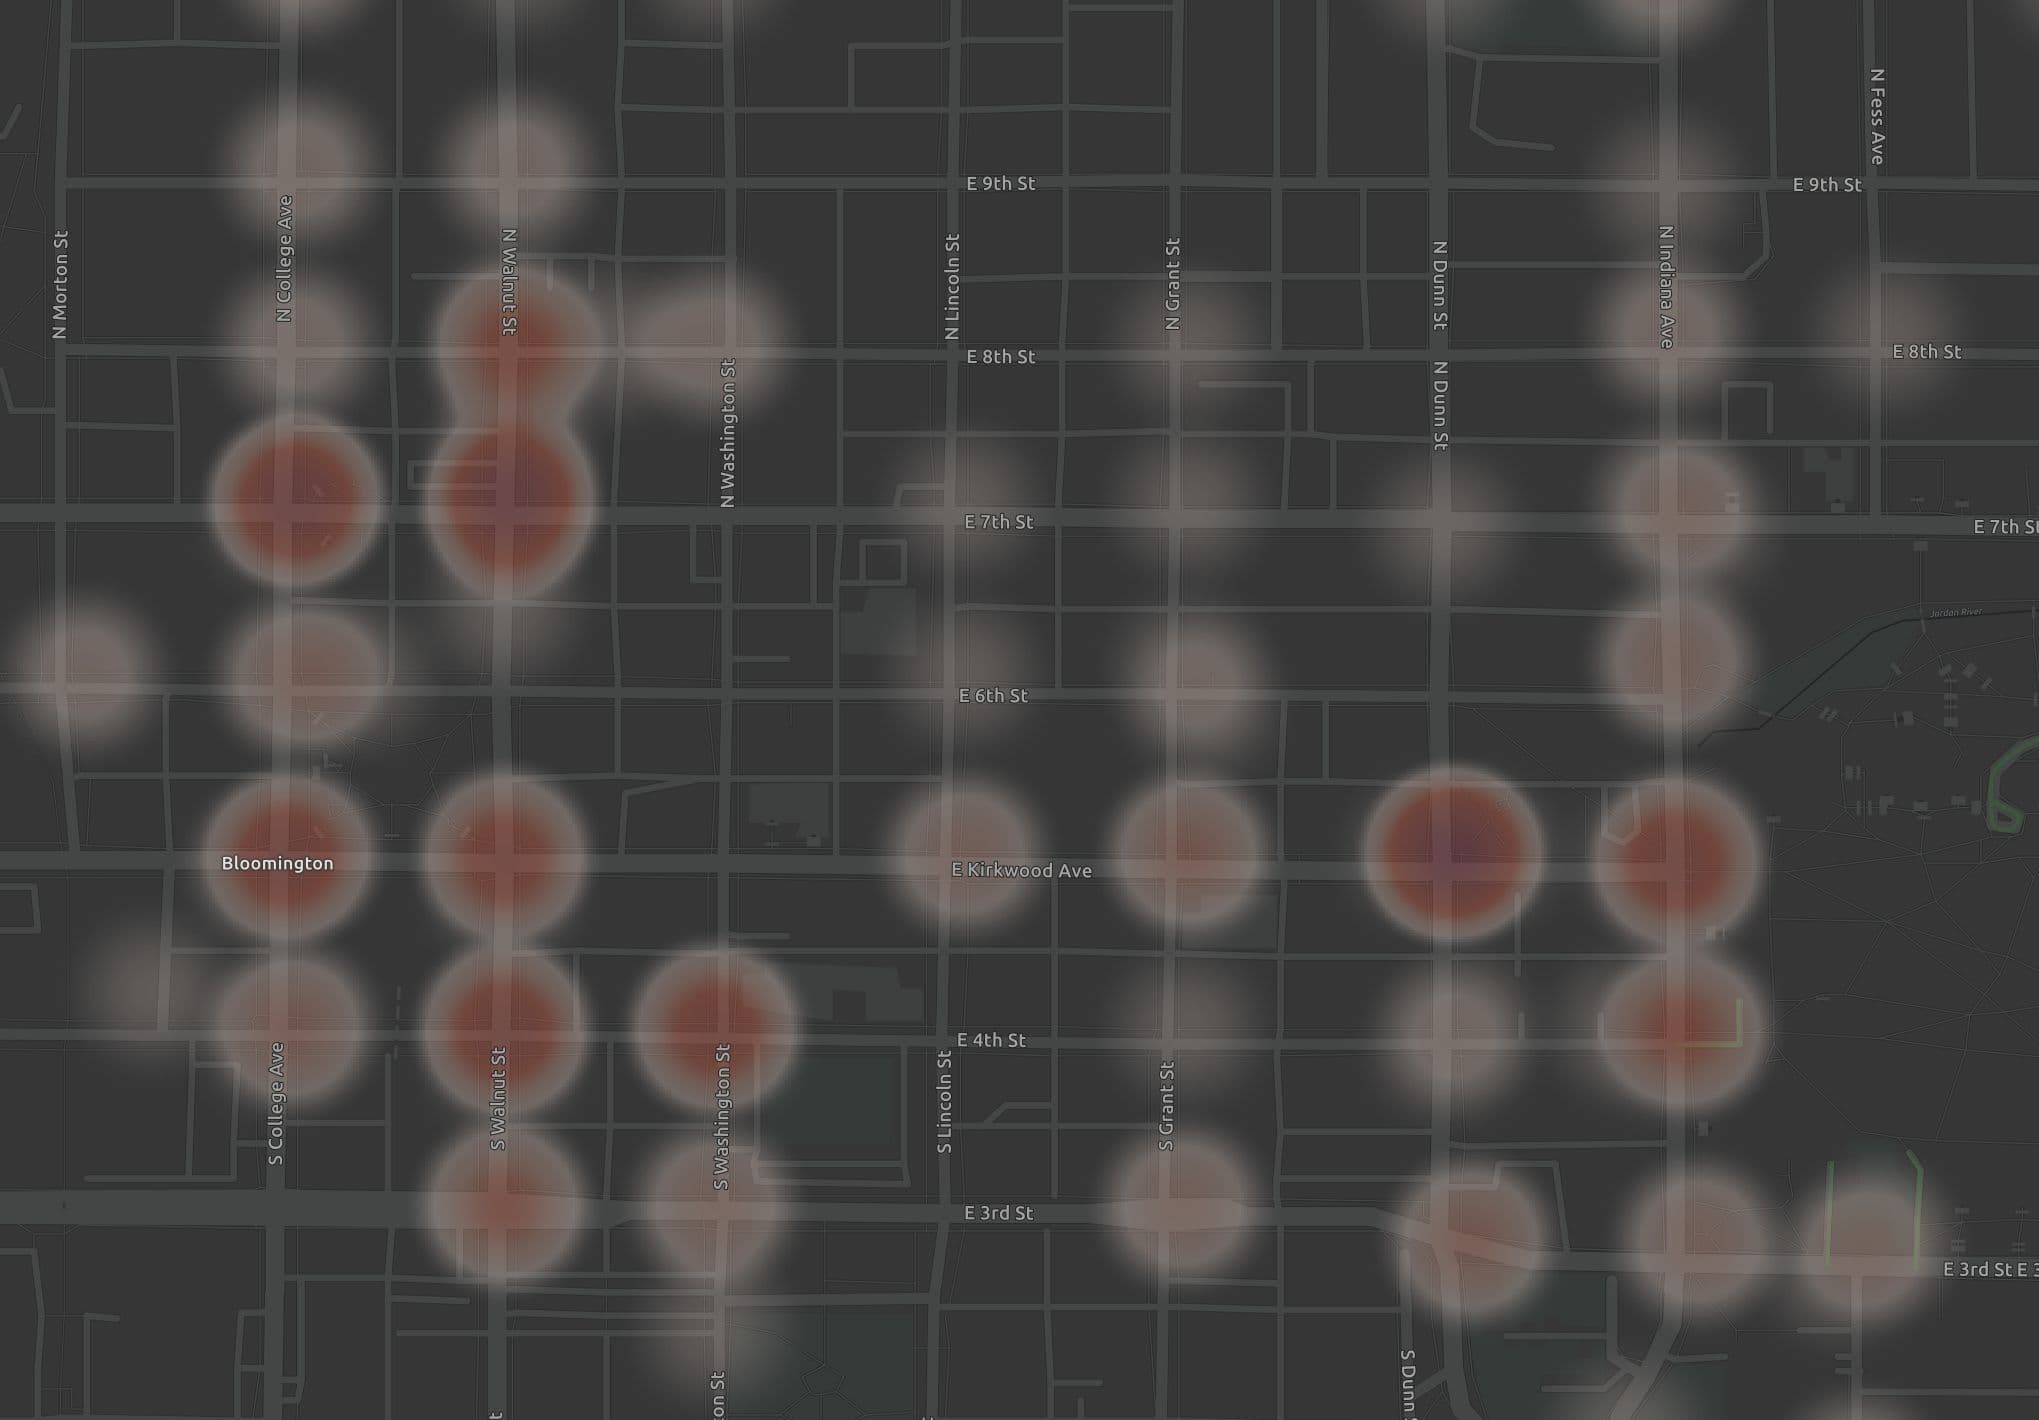
Overview maps
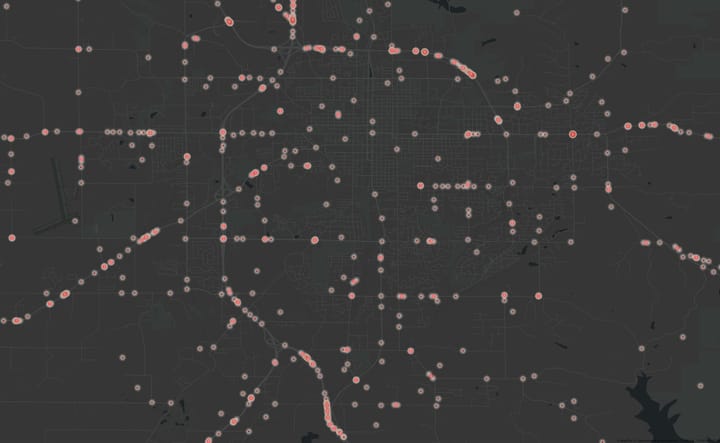
We'll start with bird's eye view that shows the intersections with the highest concentration of crashes.
These large, detailed maps are best viewed on a desktop computer rather than a phone.
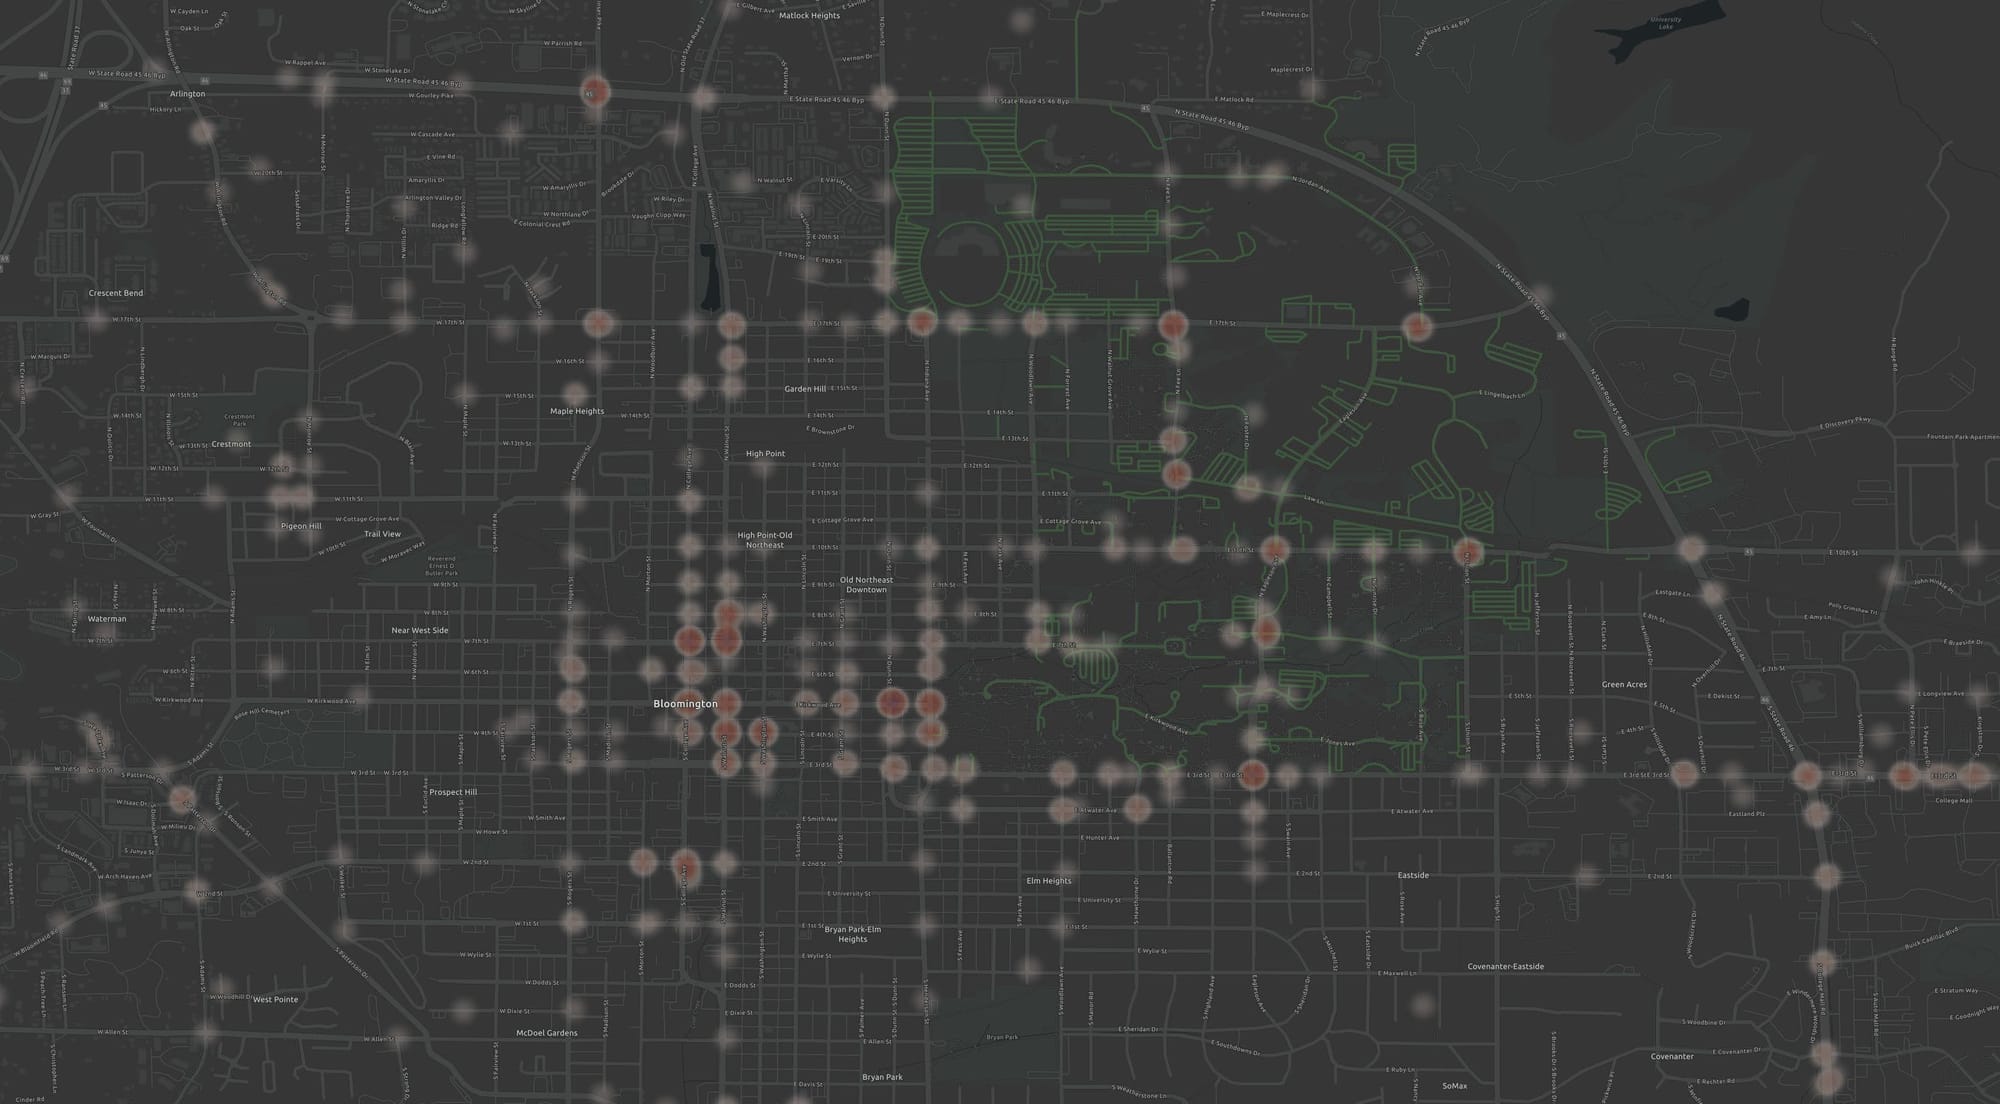
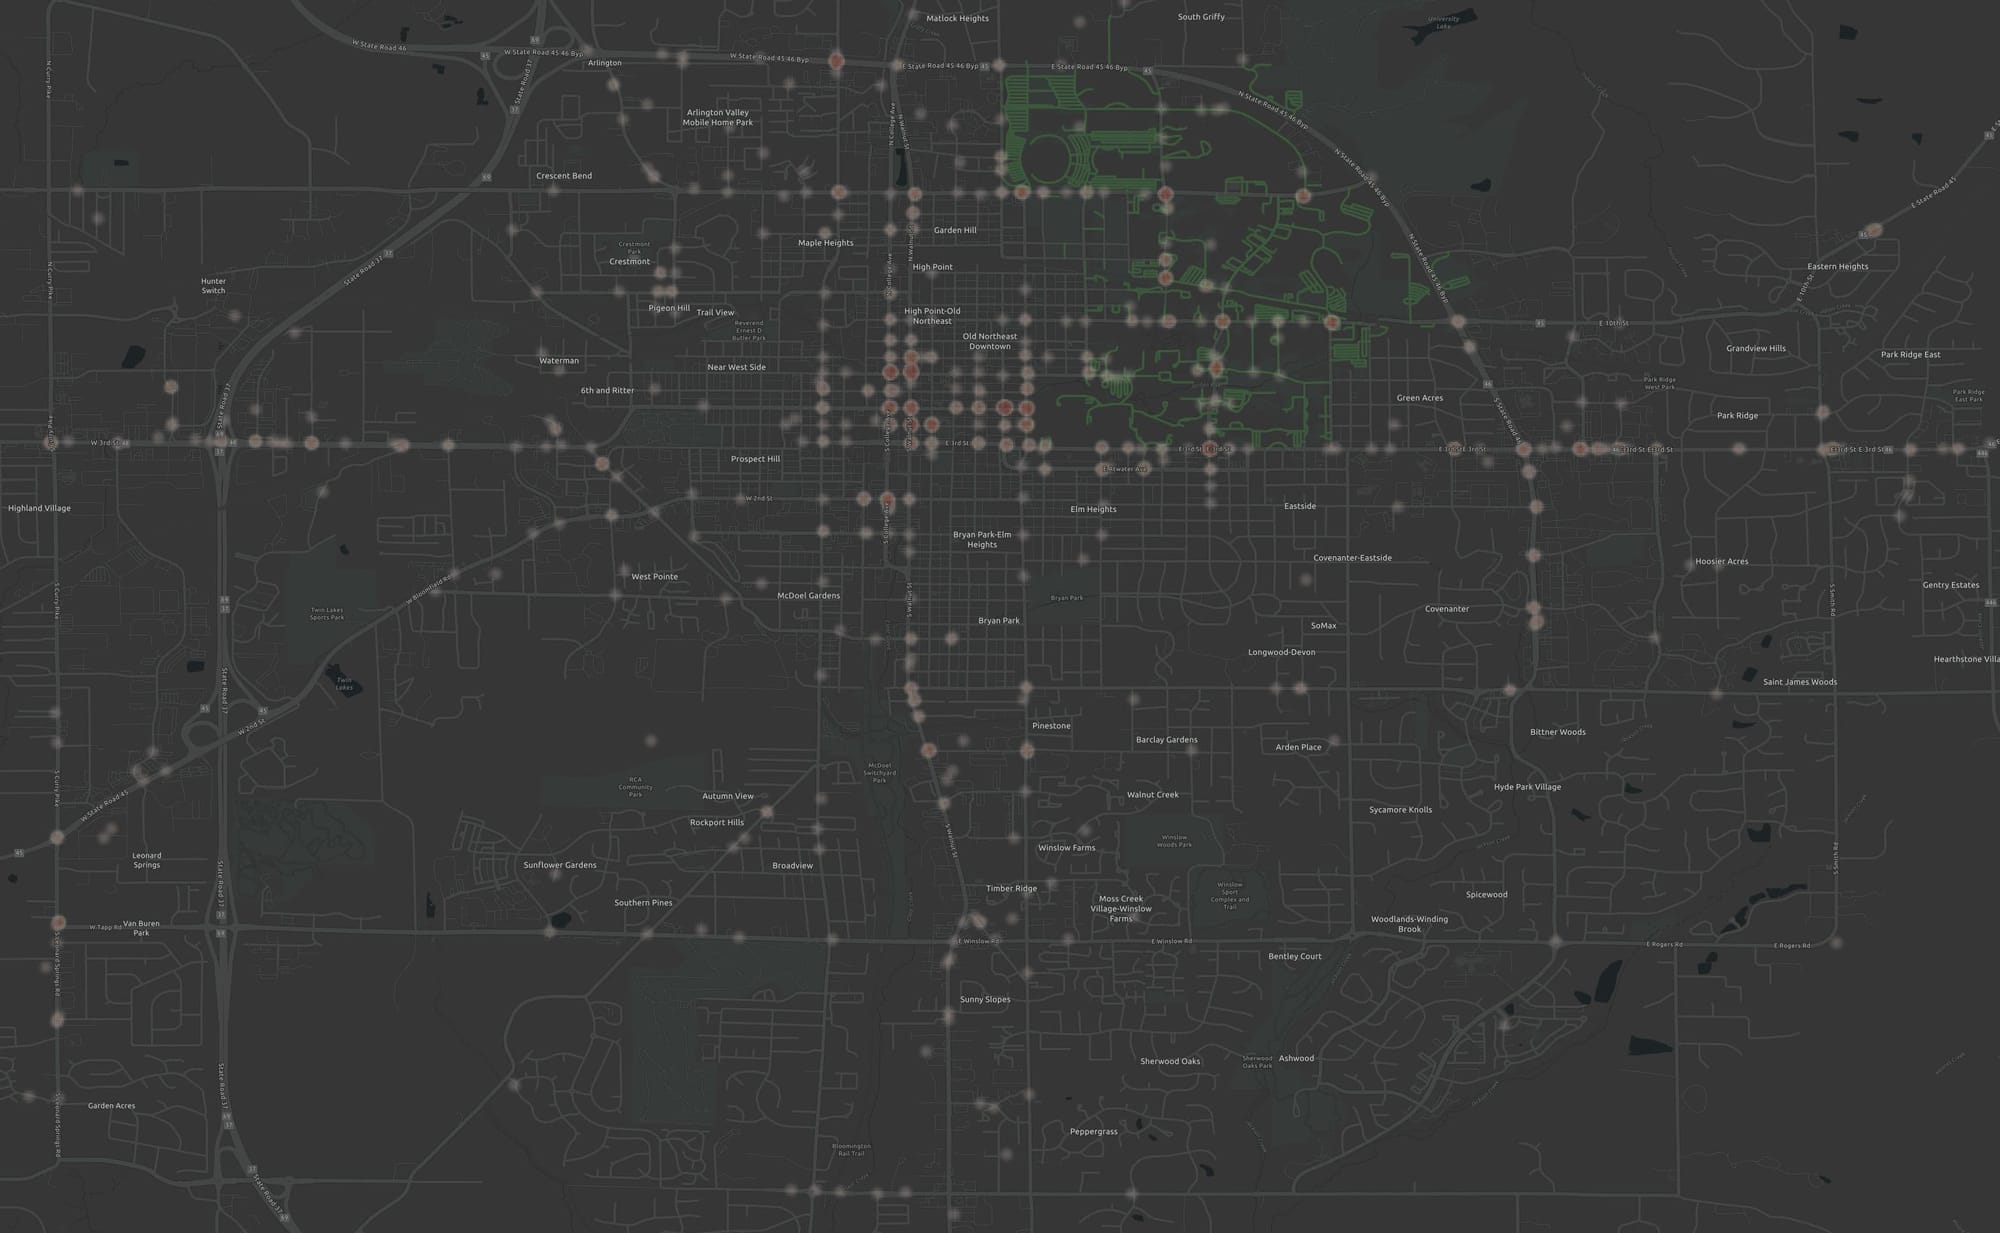

Now let's look at some details.
The intersection with the most pedestrian crashes in Bloomington
The intersection with the most pedestrian crashes within Bloomington was at the intersection of Dunn Street and Kirkwood, by People's Park, with 16 crashes involving pedestrians.
Most of the crashes have a primary factor of "failure to yield" and "Driver DRR", which appears to be the code for distracted driving. A minority were "pedestrian action", suggesting the pedestrian was at fault.
Although this intersection was the most dangerous in the past twenty years, there's reason to believe that it won't be in the next twenty years. That's because the City has already installed seasonal bollards there, and there is discussion about Kirkwood becoming a slower "shared street" in the future with year-round design changes.
Also notice how in the middle blocks of Kirkwood, around the library, there are almost no crashes, yet it would have nearly the same amount of pedestrian traffic. The map shows that crashes happen when you mix pedestrian volume with higher speed and higher volume roads. In this case, Dunn Street.
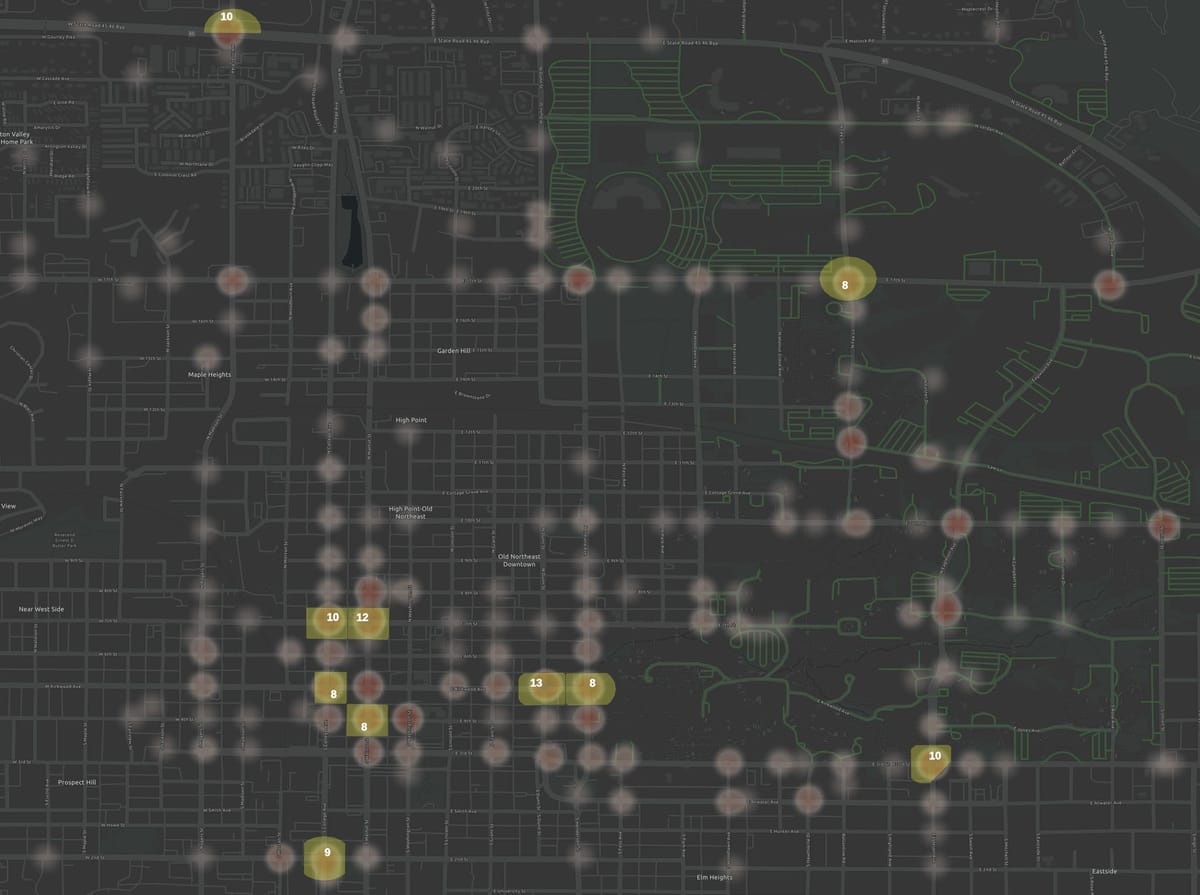
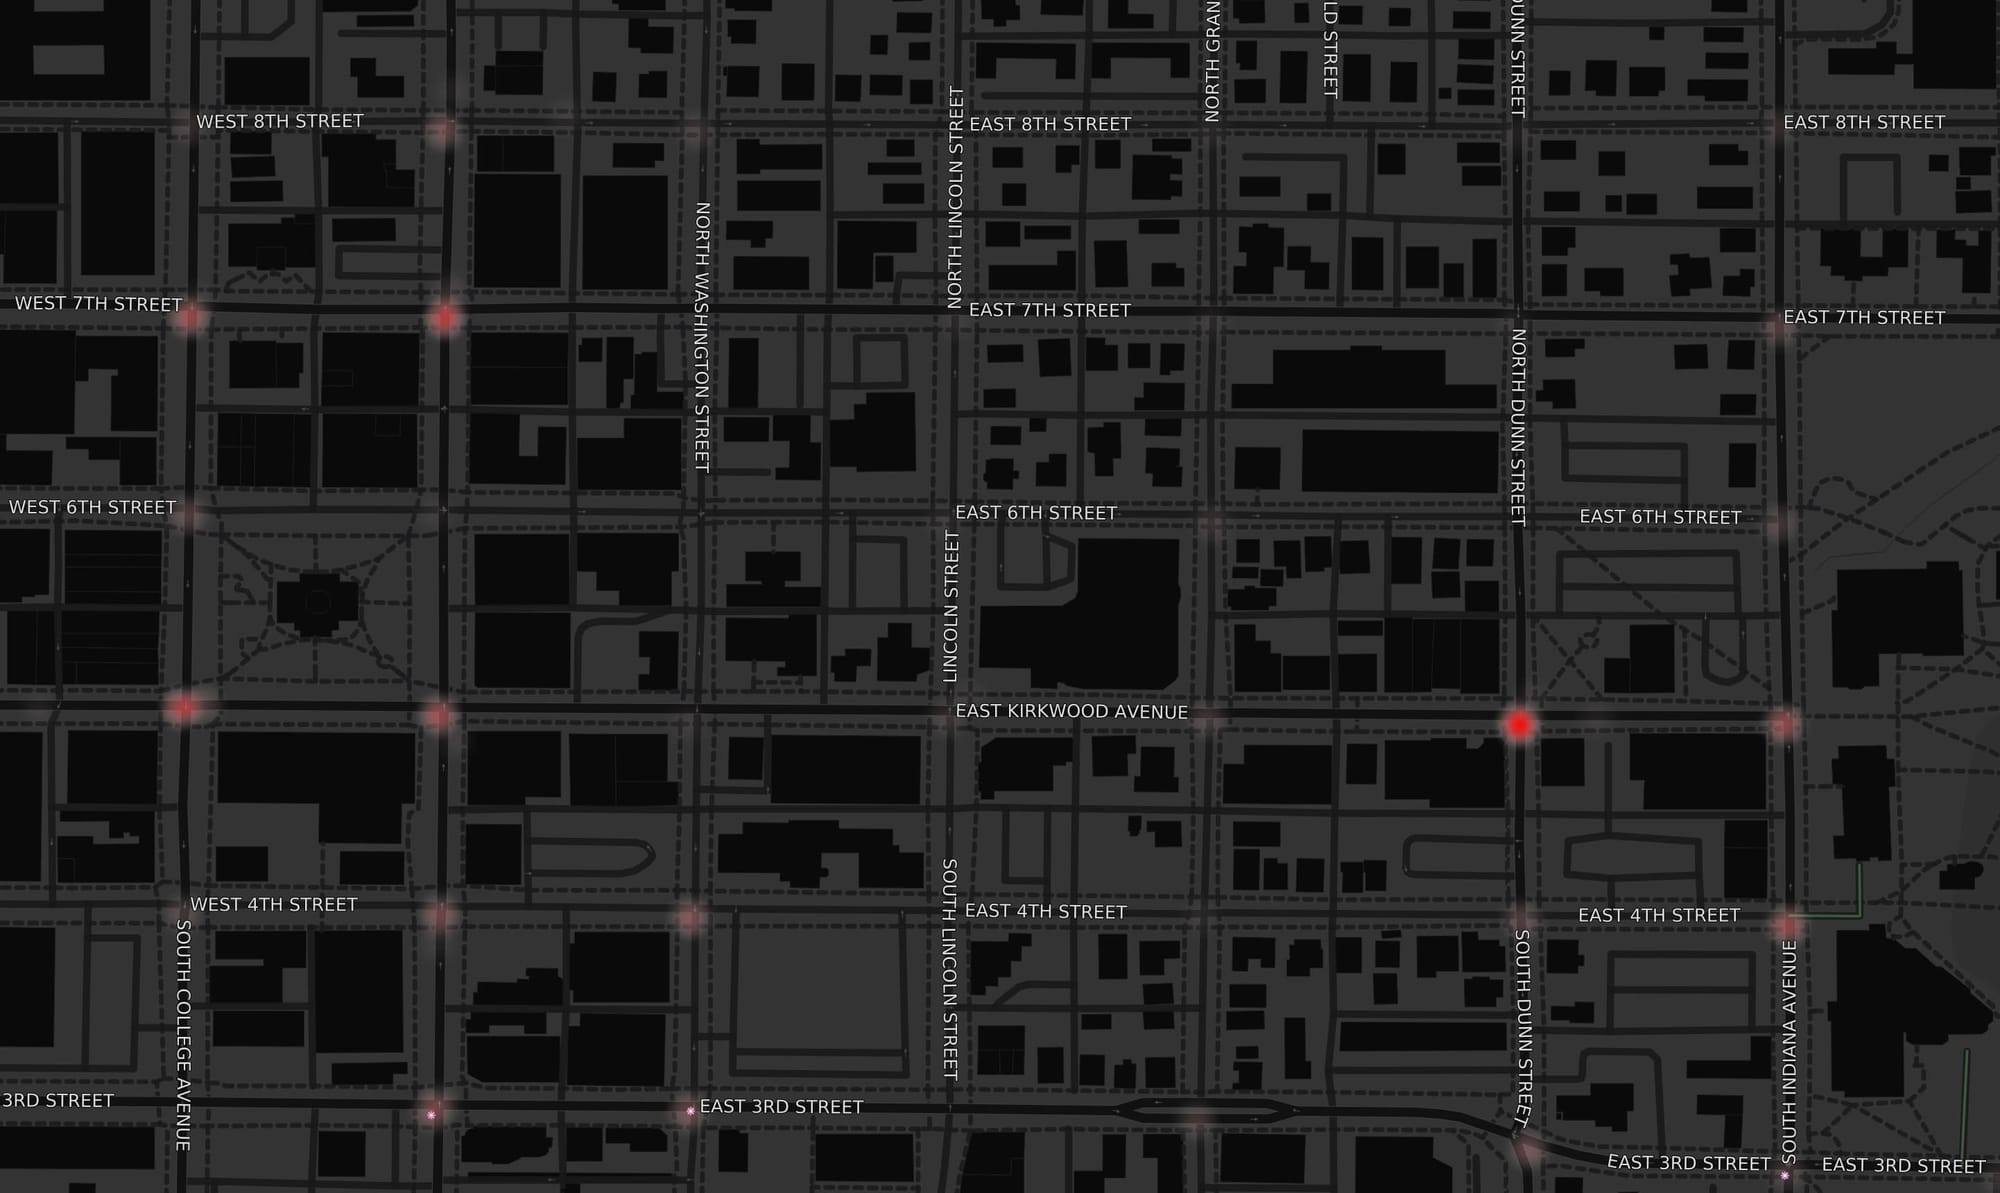
Top Five Intersections for Pedestrian Crashes
In the next map, the top five intersections for pedestrian crashes are highlighted with red hexes. Each one had more than 10 pedestrian-involved crashes from 2003-2022.
Traffic volumes are highlighted as well with a reddish color. This shows that all these intersections involve crossing some of our highest volume groups. Only one intersection did not involve any streets with the highest volume of crashes and that was Kirkwood and Dunn Street, which has the most crashes. It would expected that crashes might scale with traffic volume, but that wasn't the case there.
The other top intersections for pedestrian-involved crashes were:
- Seventh and Walnut
- Seventh and College
- Kinser and the Bypass
- Third and Eagleson
We'll look at all those and in a bit more detail below.
College and Walnut: Dangerous corridors
One thing seen on the map is that some clusters of pedestrian crashes are all along the same street. For example, here's a detail that shows College and Walnut as they pass by the courthouse. Two of the top five locations were along Kirkwood, while Walnut Street was the location of a number of crashes as well as a pedestrian fatality.

In that case the City is already in the process of a College and Walnut Corridor study. Potential design updates could include the option of narrowing the street from three lanes to two, which could have the effect of shortening pedestrian crossing distances and reducing vehicle speeds.
Another striking detail when looking at corridors with high crash rates for pedestrians is how many of them are adjacent to Indiana University or pass through it. There are many crash hotspots along 17th, 10th, 3rd, Eagleson and Fee. Some of these locations have already had safety updates in the last twenty years, including bike lanes on Third Street, more side paths along 17th Street, and the 7-Line.
It's also notable where there aren't pedestrian-involved crashes related to IU, and that's in the interior of the campus where cars are prohibited or restricted. Abstinence from driving is apparently safe driving.
The idea has been floated at times to update the design of part of 10th street to restrict cars there. Doing so may address the crash rate at 10th and Eagleson if turning onto 10th Street was prohibited there.
Kinser and the Bypass: high crash rate and a fatality
Kinser and the Bypass both had a high concentration of pedestrian crashes and also a fatality. The crash fatality there wasn't a pedestrian so it doesn't appear on the maps here. However given the trend there as a high crash location, a pedestrian fatality there is predicted from the data if the conditions do not improve.
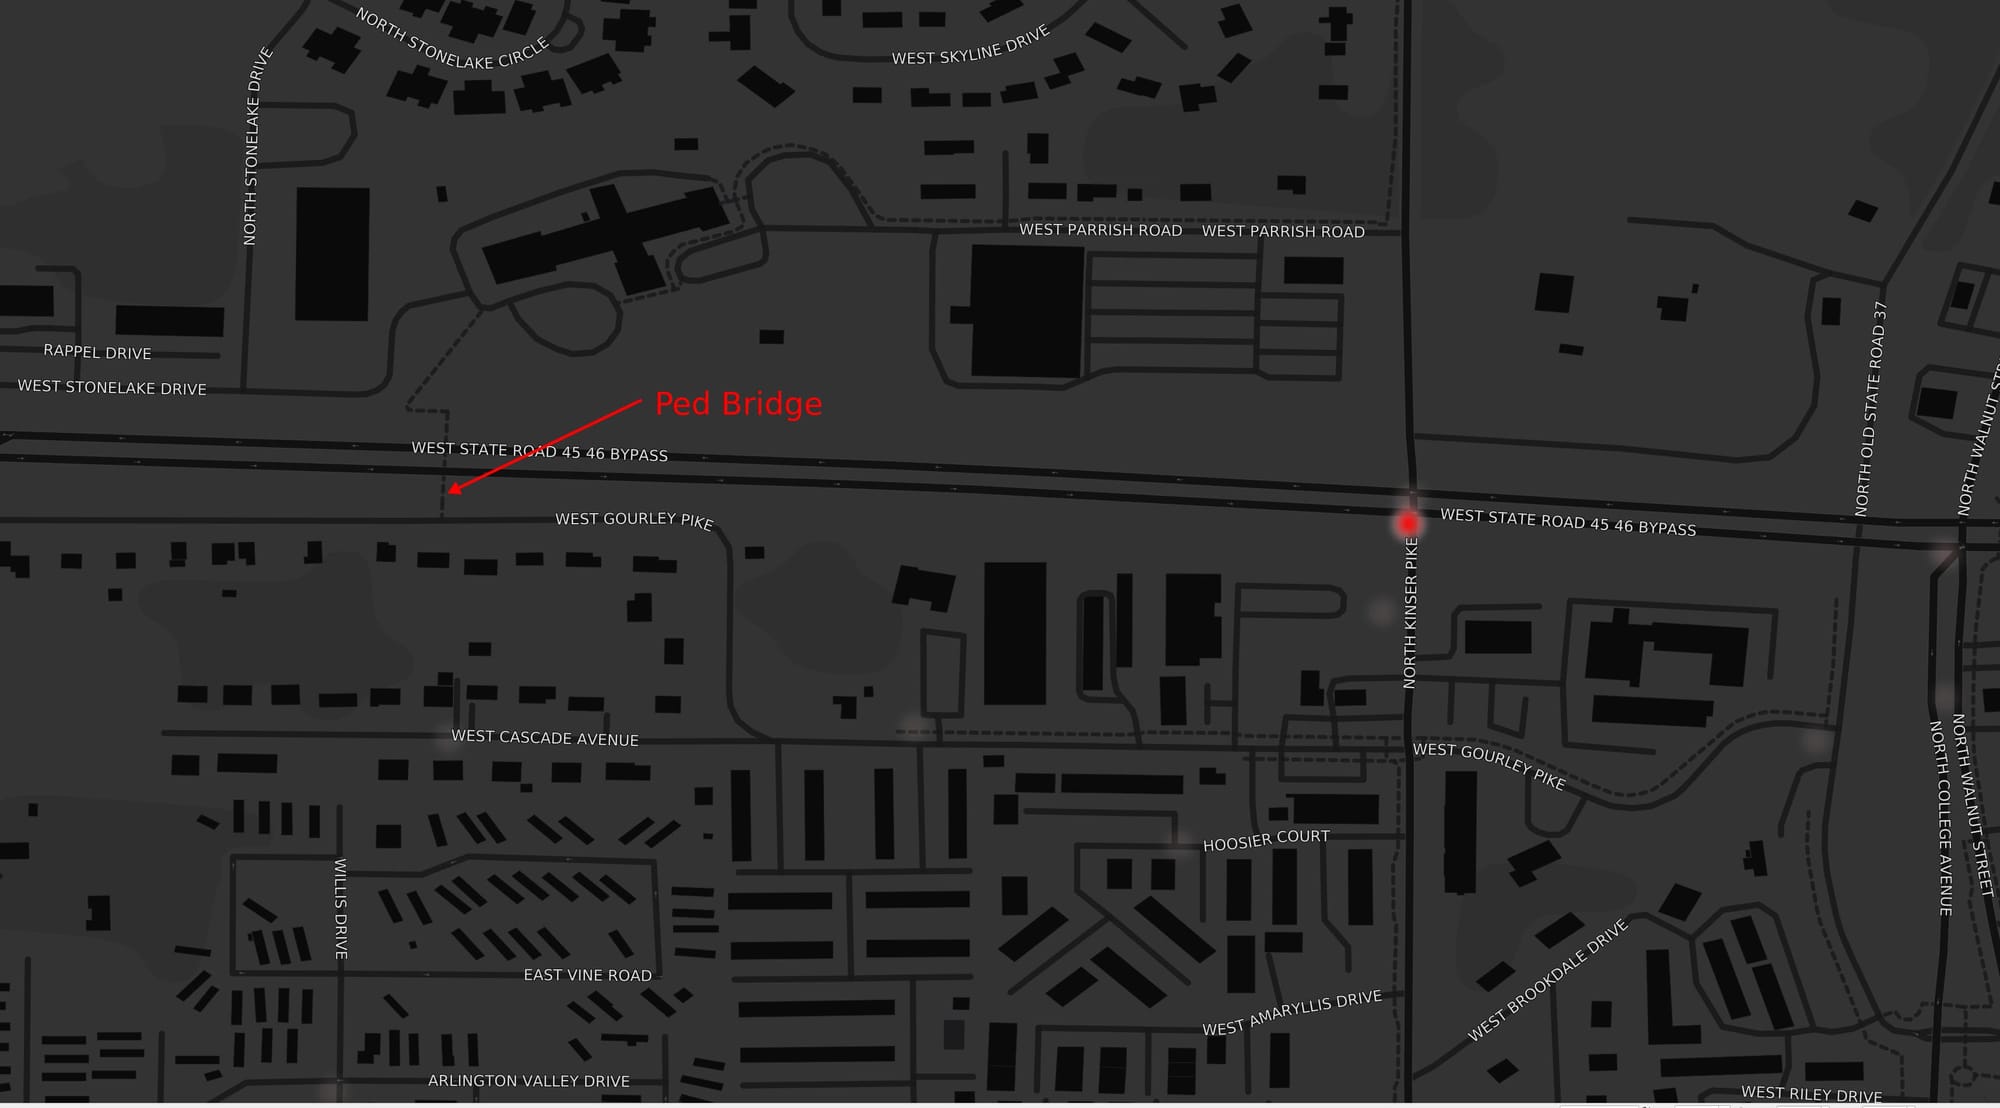
This outcome is tragic and somewhat preventable because there's a pedestrian bridge a short distance away.
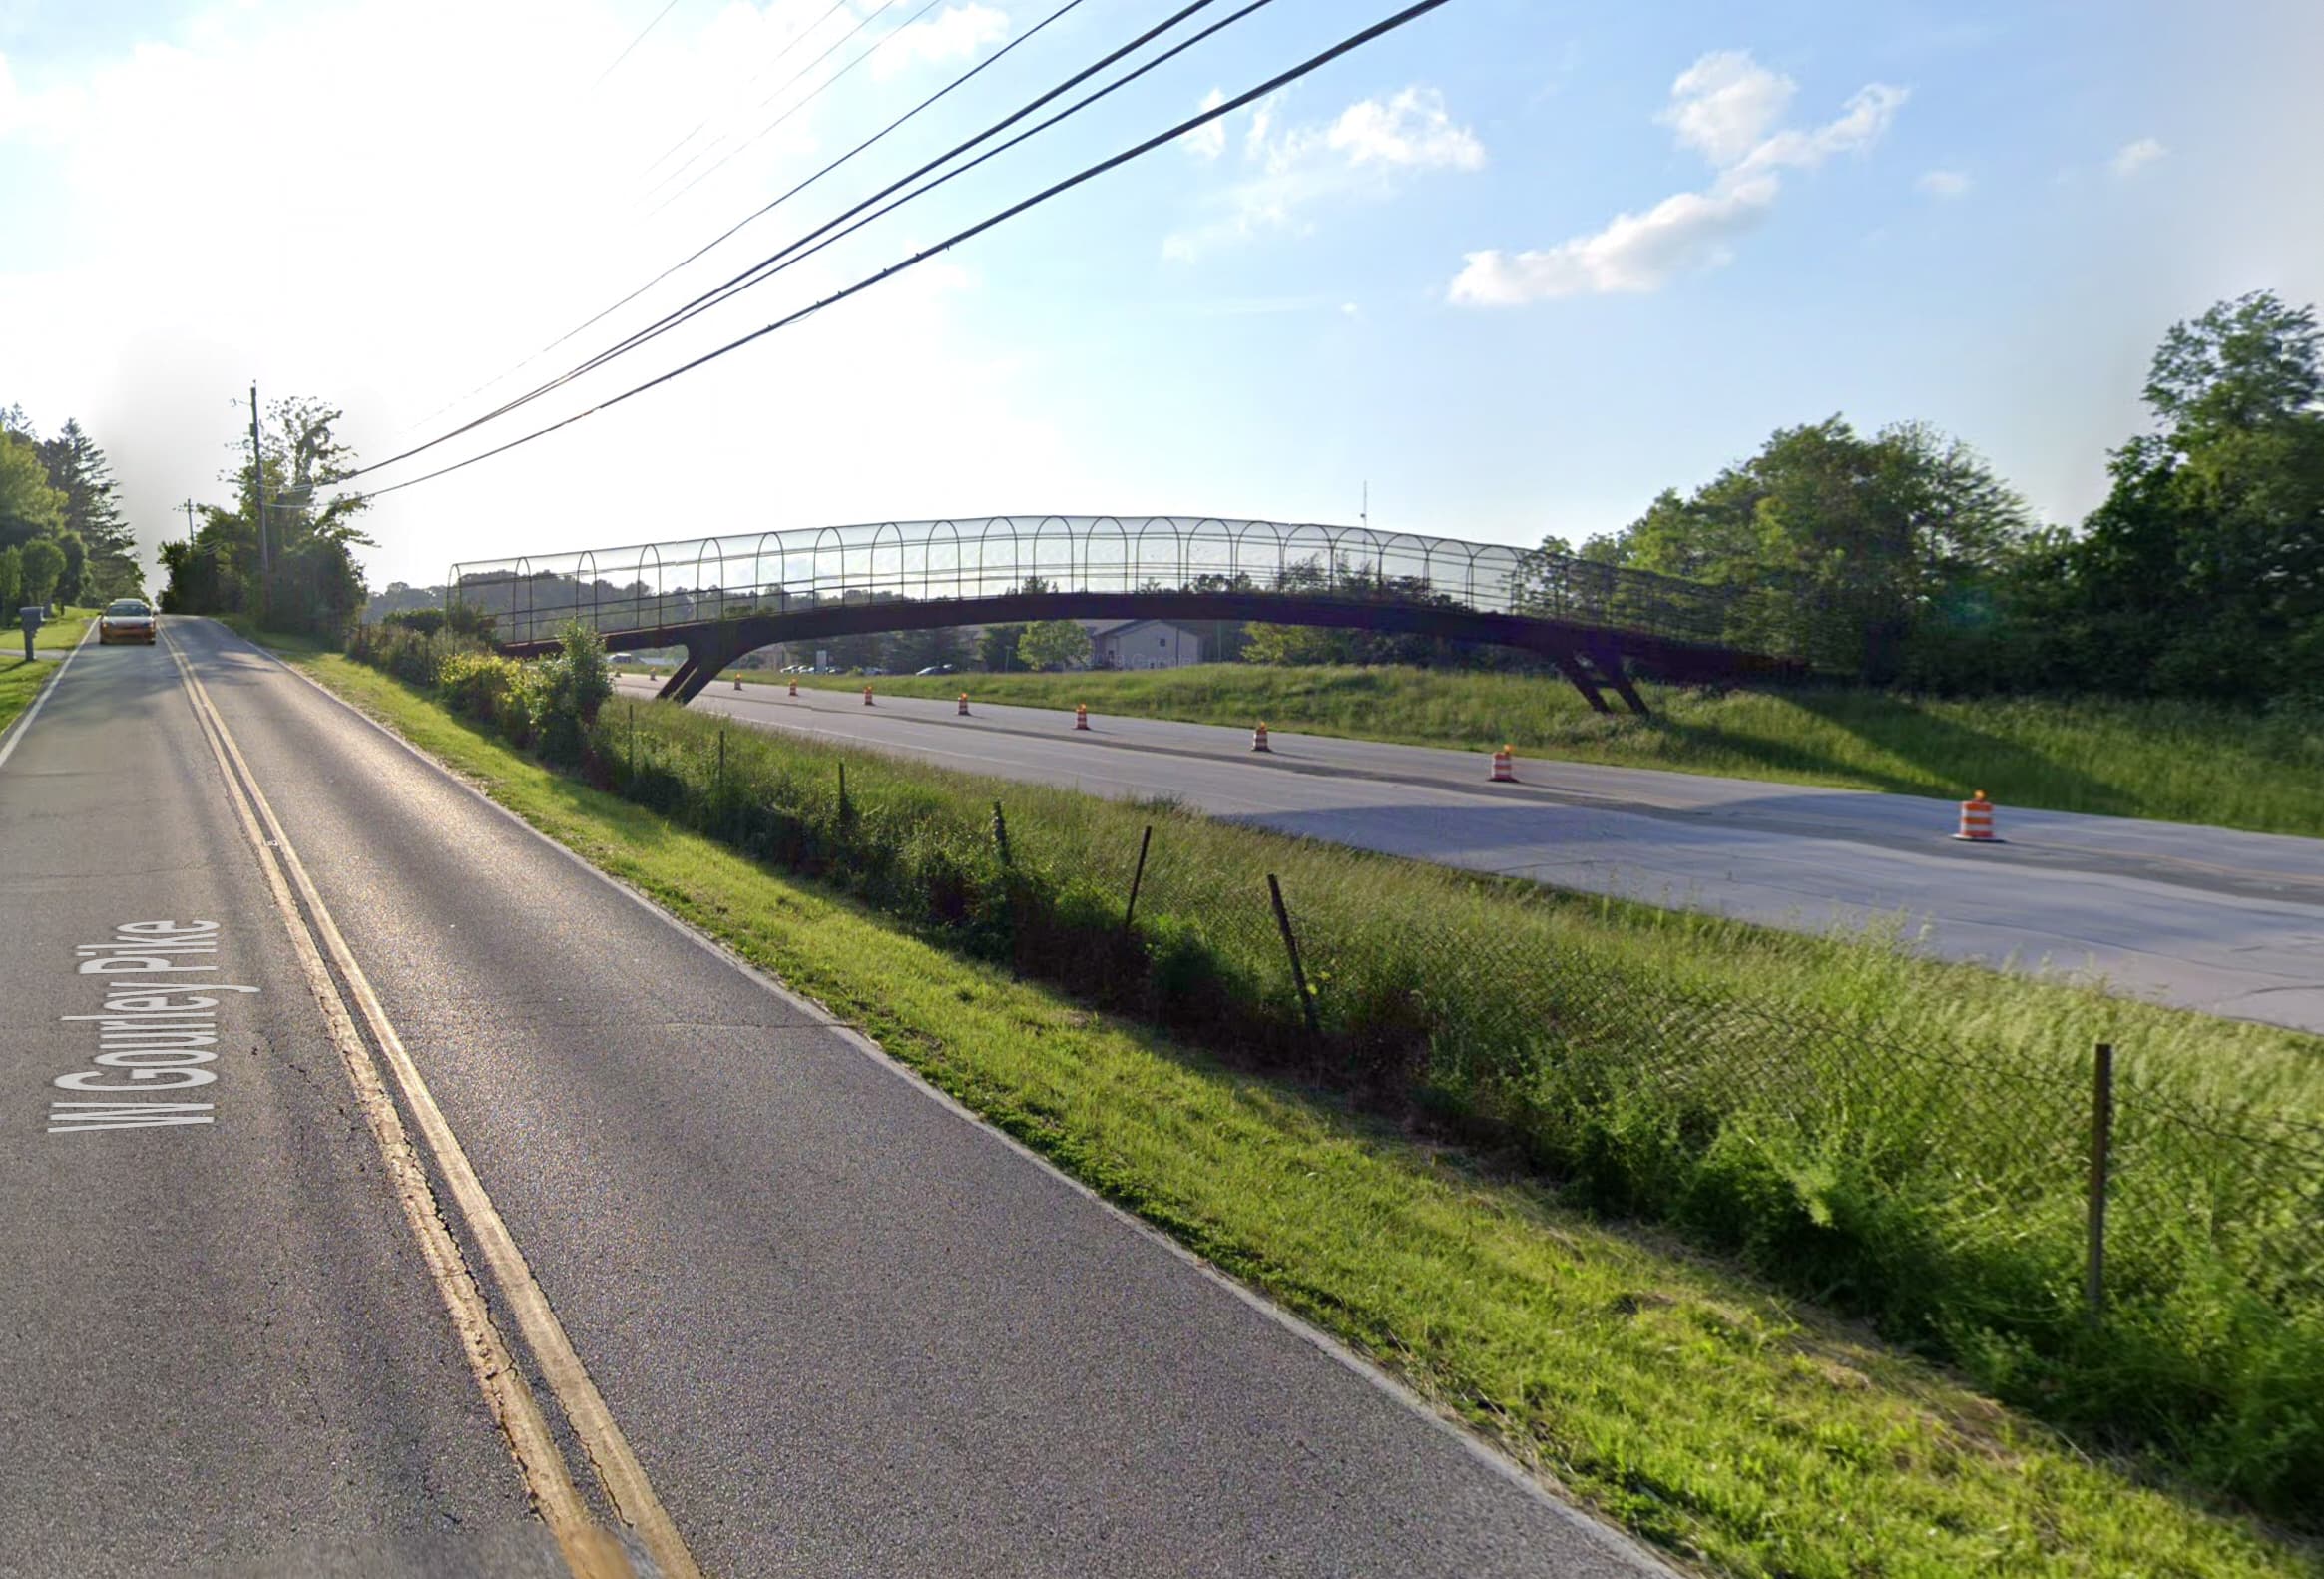
But pedestrians can be forgiven for not using it. The south side is connected to a busy Gourley Pike, not a neighborhood. A neighborhood is one block south of it, but there's no direct route to get to the bridge.
Someone who lives on Willis Drive could have a pleasant quarter-mile walk to the grocery store over the pedestrian bridge if a direct route existed, but instead, it's a much longer, indirect route to get there that may involve crossing the bypass at Kinser.
Addressing this situation is an equity issue as well as a safety issue– for decades a lower-income neighborhood has been cut off from a safe, efficient walk to a nearby grocery store due to the inaccessible pedestrian bridge. The best alternative is a much longer walk through one of the most dangerous intersections in the city.
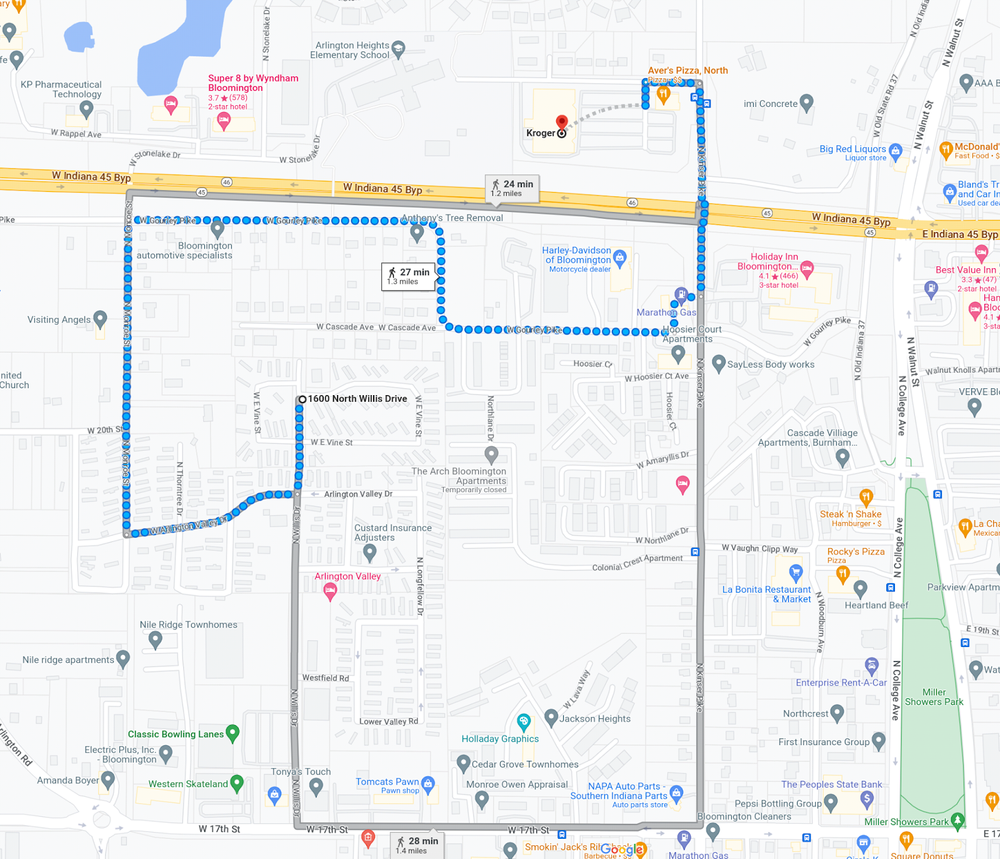
Fixing the bridge connection is already in long-term plans, but it was not on the "priority" list. Here it is in the long-term transportation plan:
Another project that wasn't in the priority list was adding a multi-use path through Cascades Park or closing that road, a project the Hamilton administration took up anyway. Looking through the lens of crash data, there were no pedestrian or bike crashes along the corridor proposed to be closed in the past twenty years.
If the goal is to the have biggest reduction in pedestrian fatalities, we need to focus efforts on where they are happening.
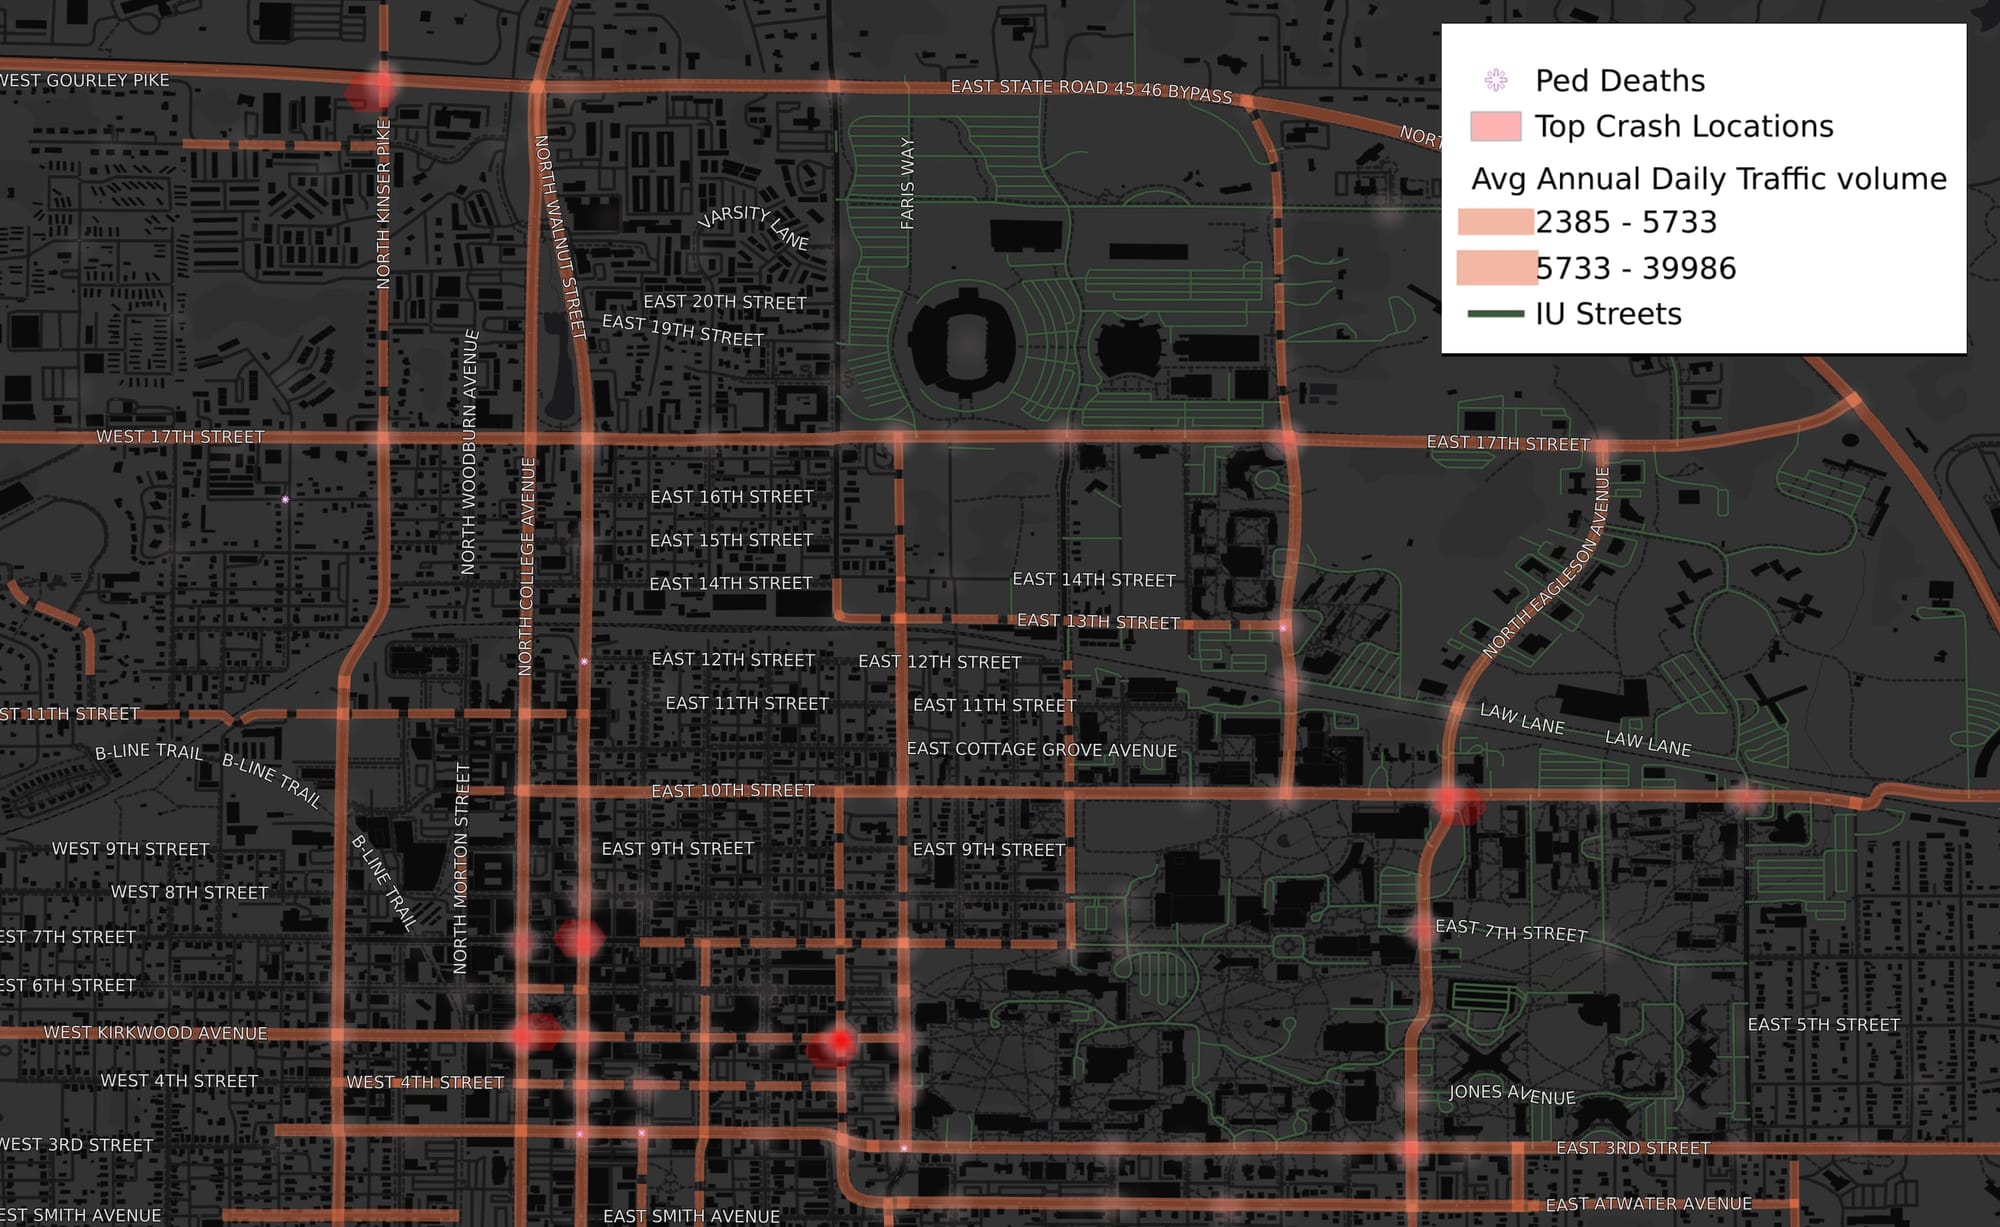
Intersections with Pedestrian Fatalities
Some maps above include stars for pedestrian fatalities. Here the locations are highlighted on their own, paired with our higher-traffic roads (dashed line) and highest-traffic roads (solid orange-ish line). You'll see the fatalities do not happen in random locations. Most happen along higher volume, higher speed streets.
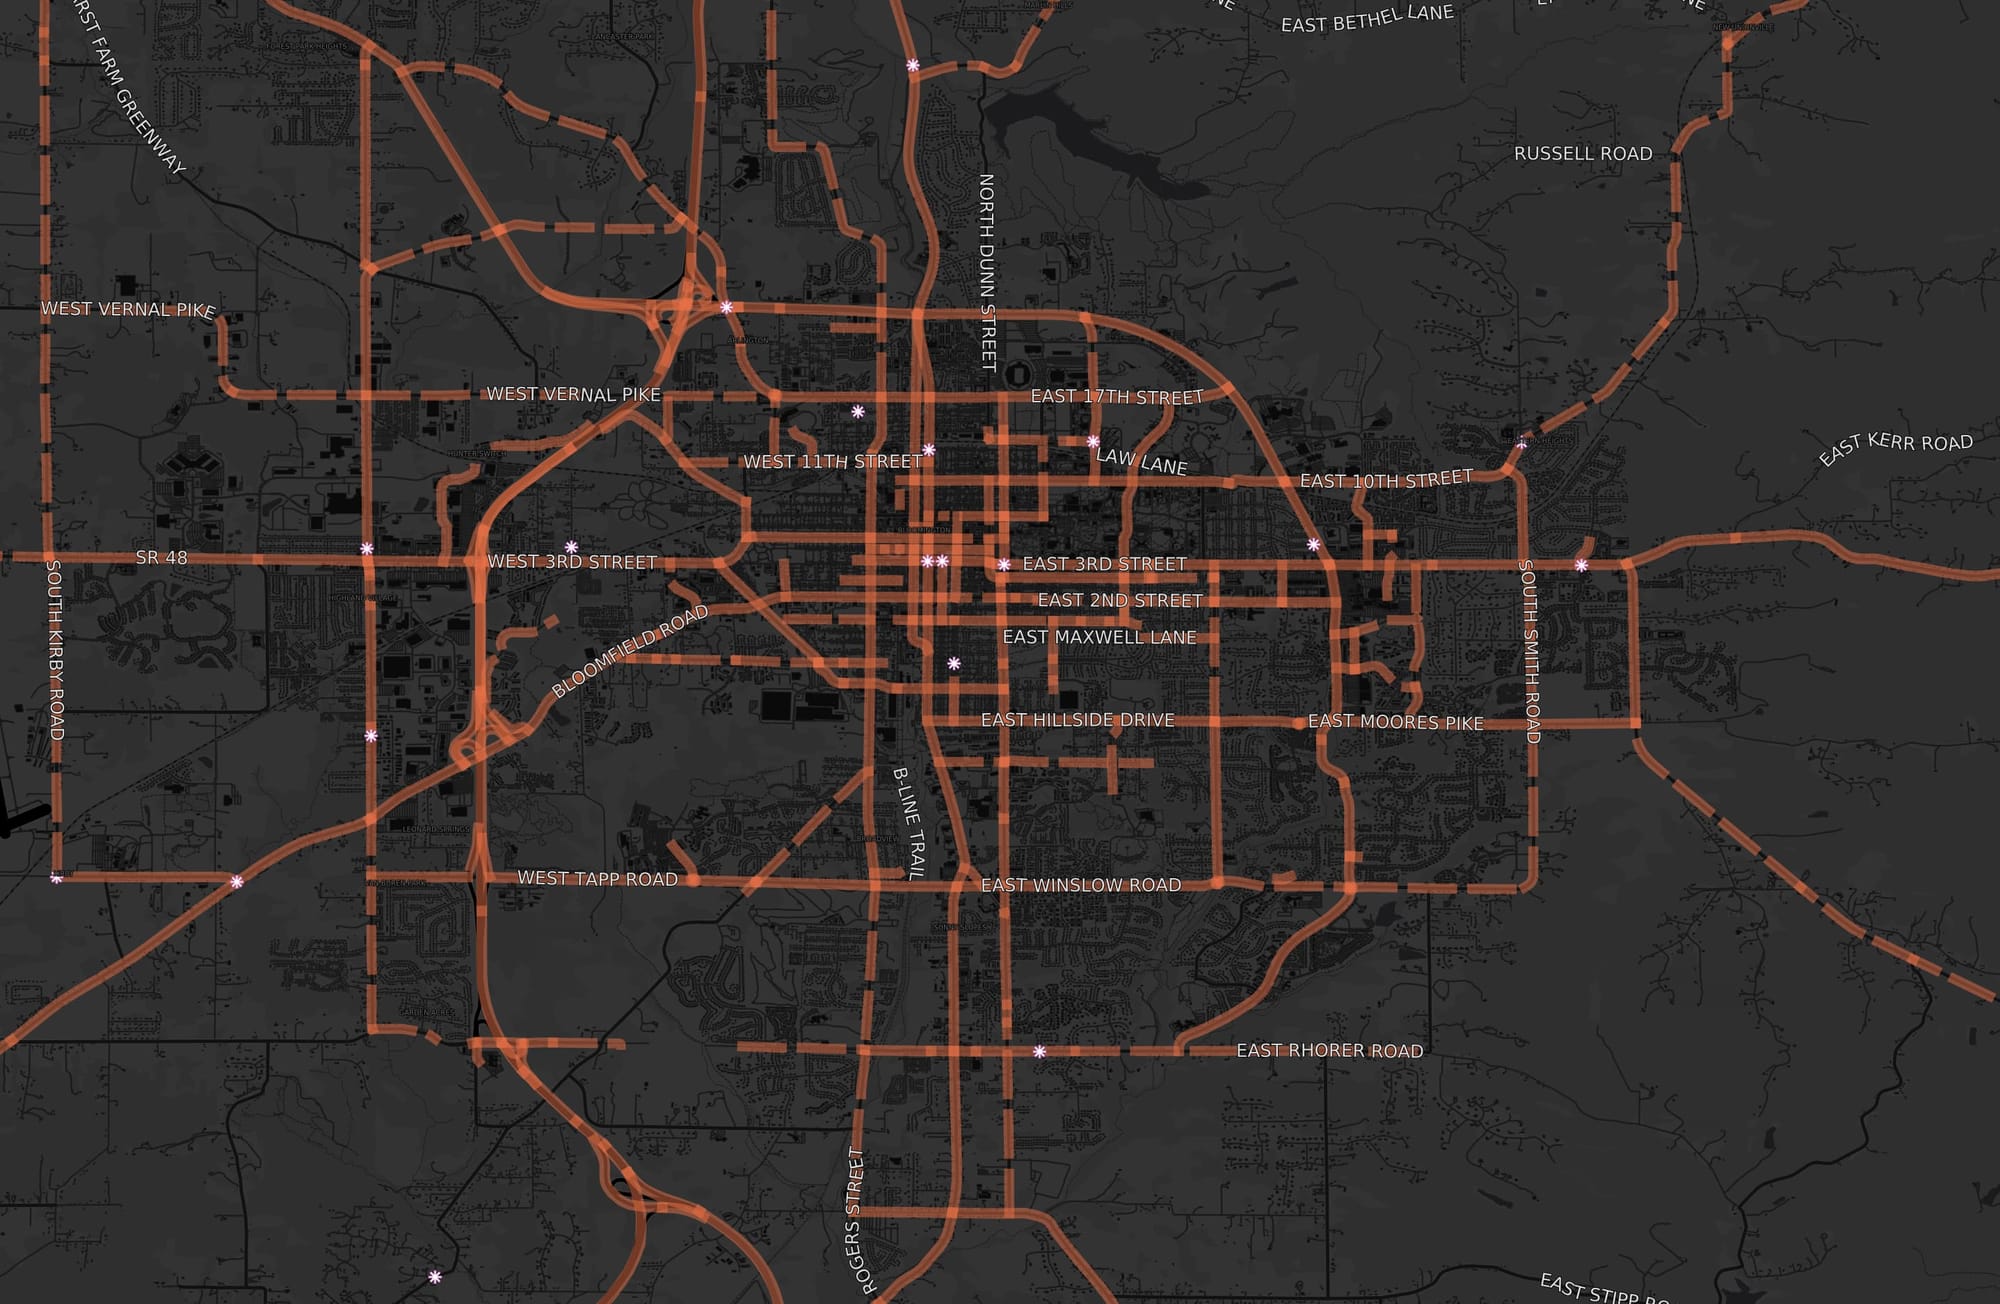
Speed kills. Safe pedestrian crossings for our higher-speed streets are important because the greater risks when we walk there.
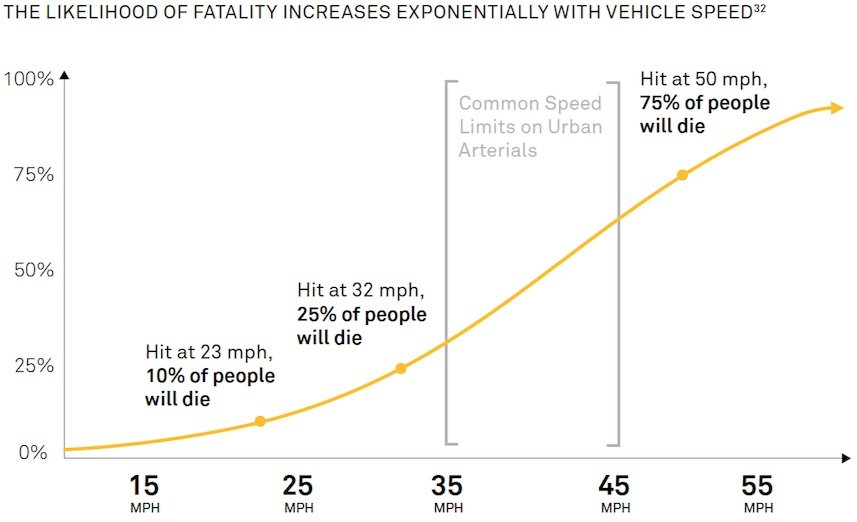
The graph is from Speed Kills courtesy of the National Association of City Transportation Professionals. A pedestrian struck at 40 MPH has about a 50% chance of survival. Street designs that with vehicle speeds of 30 MPH or 20 MPH dramatically increase the chance of survival.
The danger of crossing the 7-Line?
Recently our city council debated adding stop signs where Washington Street and Lincoln Street cross Seventh Street. Those in favor argued that these would improve pedestrian safety. The data shows one pedestrian-involved crash there over the twenty years and that case involved running a stop sign at 3 AM. This detail is easier to see on the interactive map.
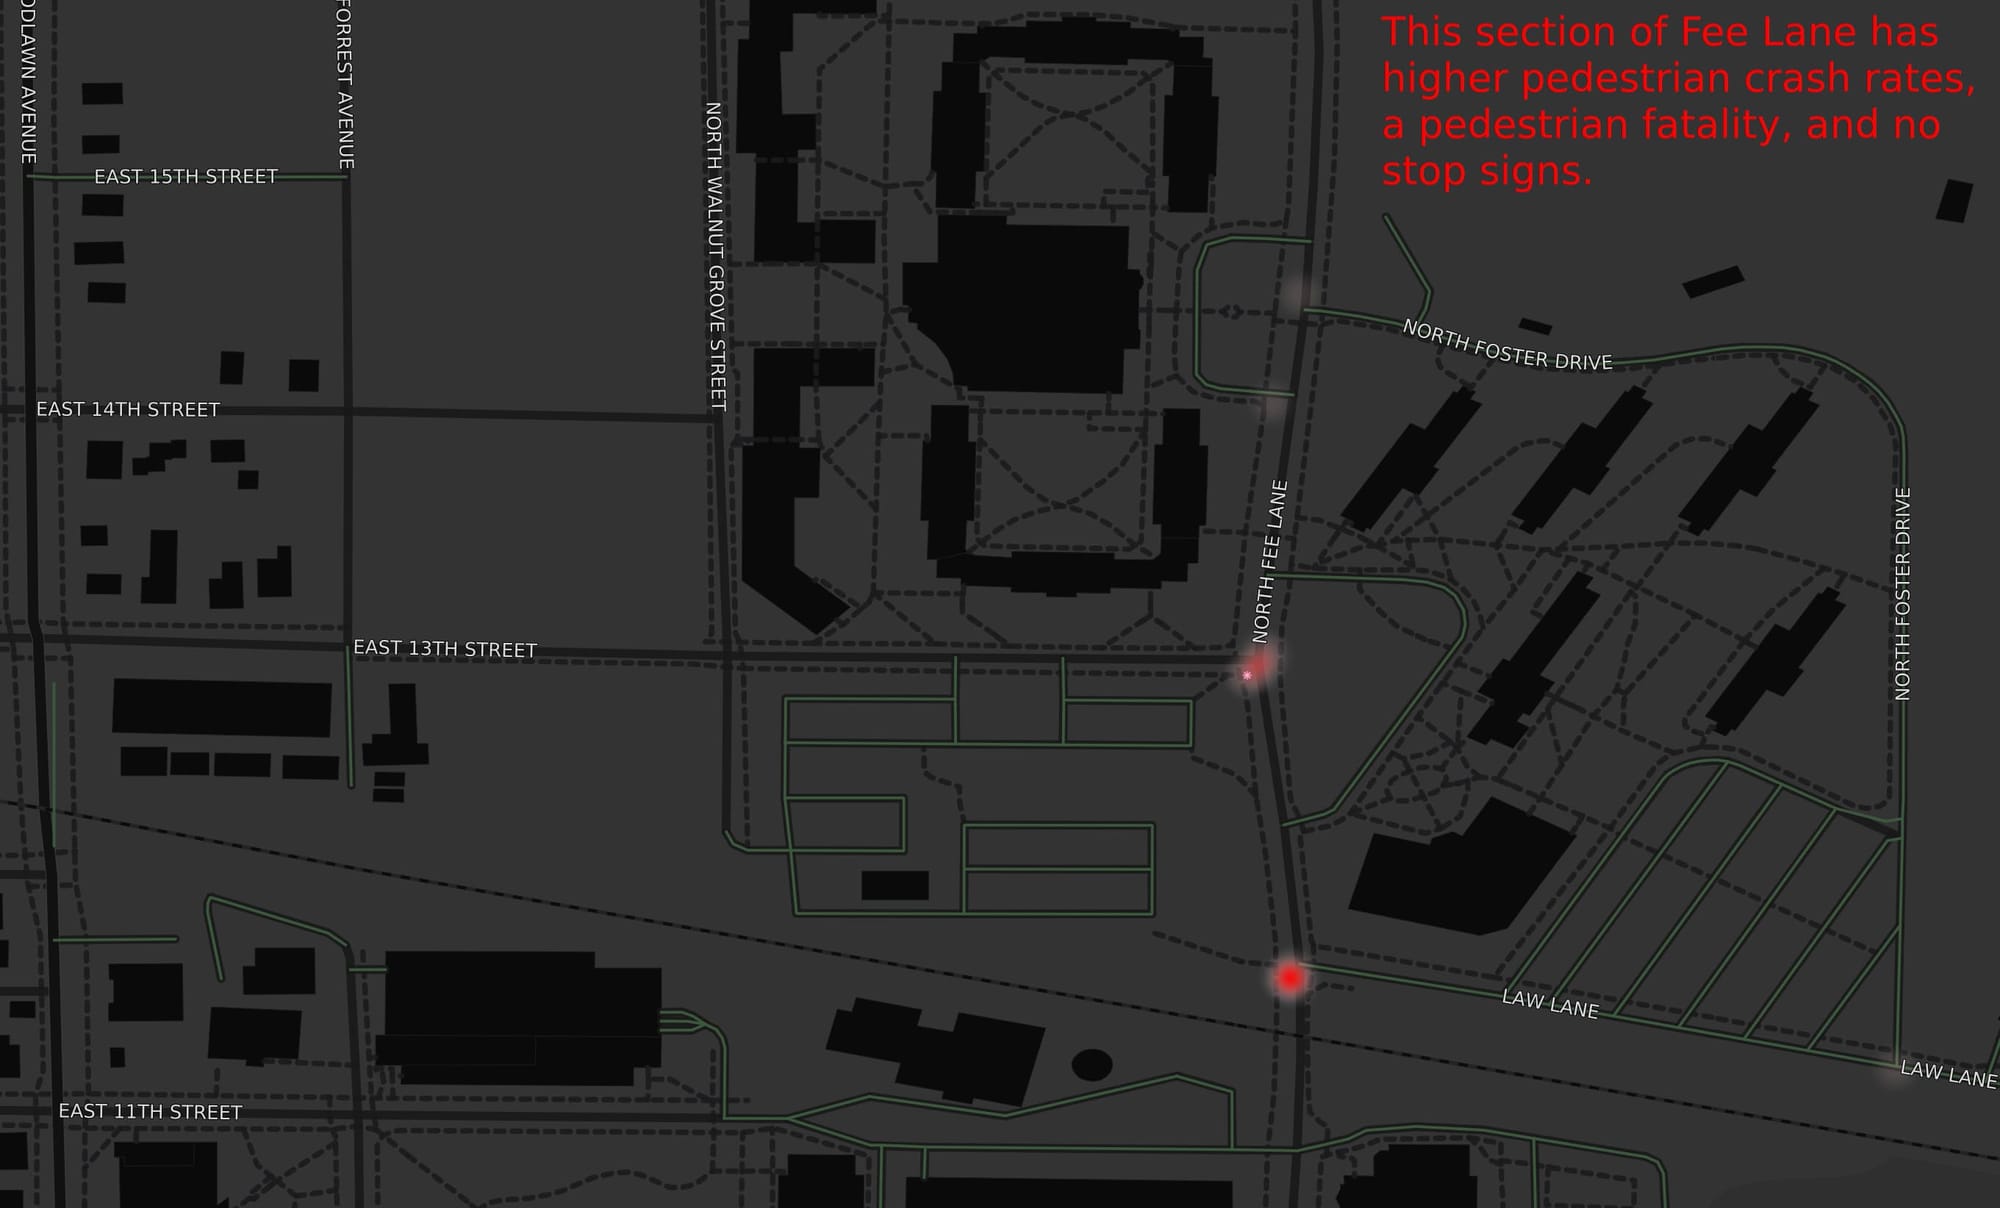
Indeed, many of the highest crash intersections have stop signs or stop lights already. If the goal was to add a stop sign where we have data showing higher rates of pedestrian crashes, then Fee Lane would be an example of a better choice. There have been 16 pedestrian crashes over the same period, including a pedestrian fatality. There are no stop signs along Fee Lane in this corridor.
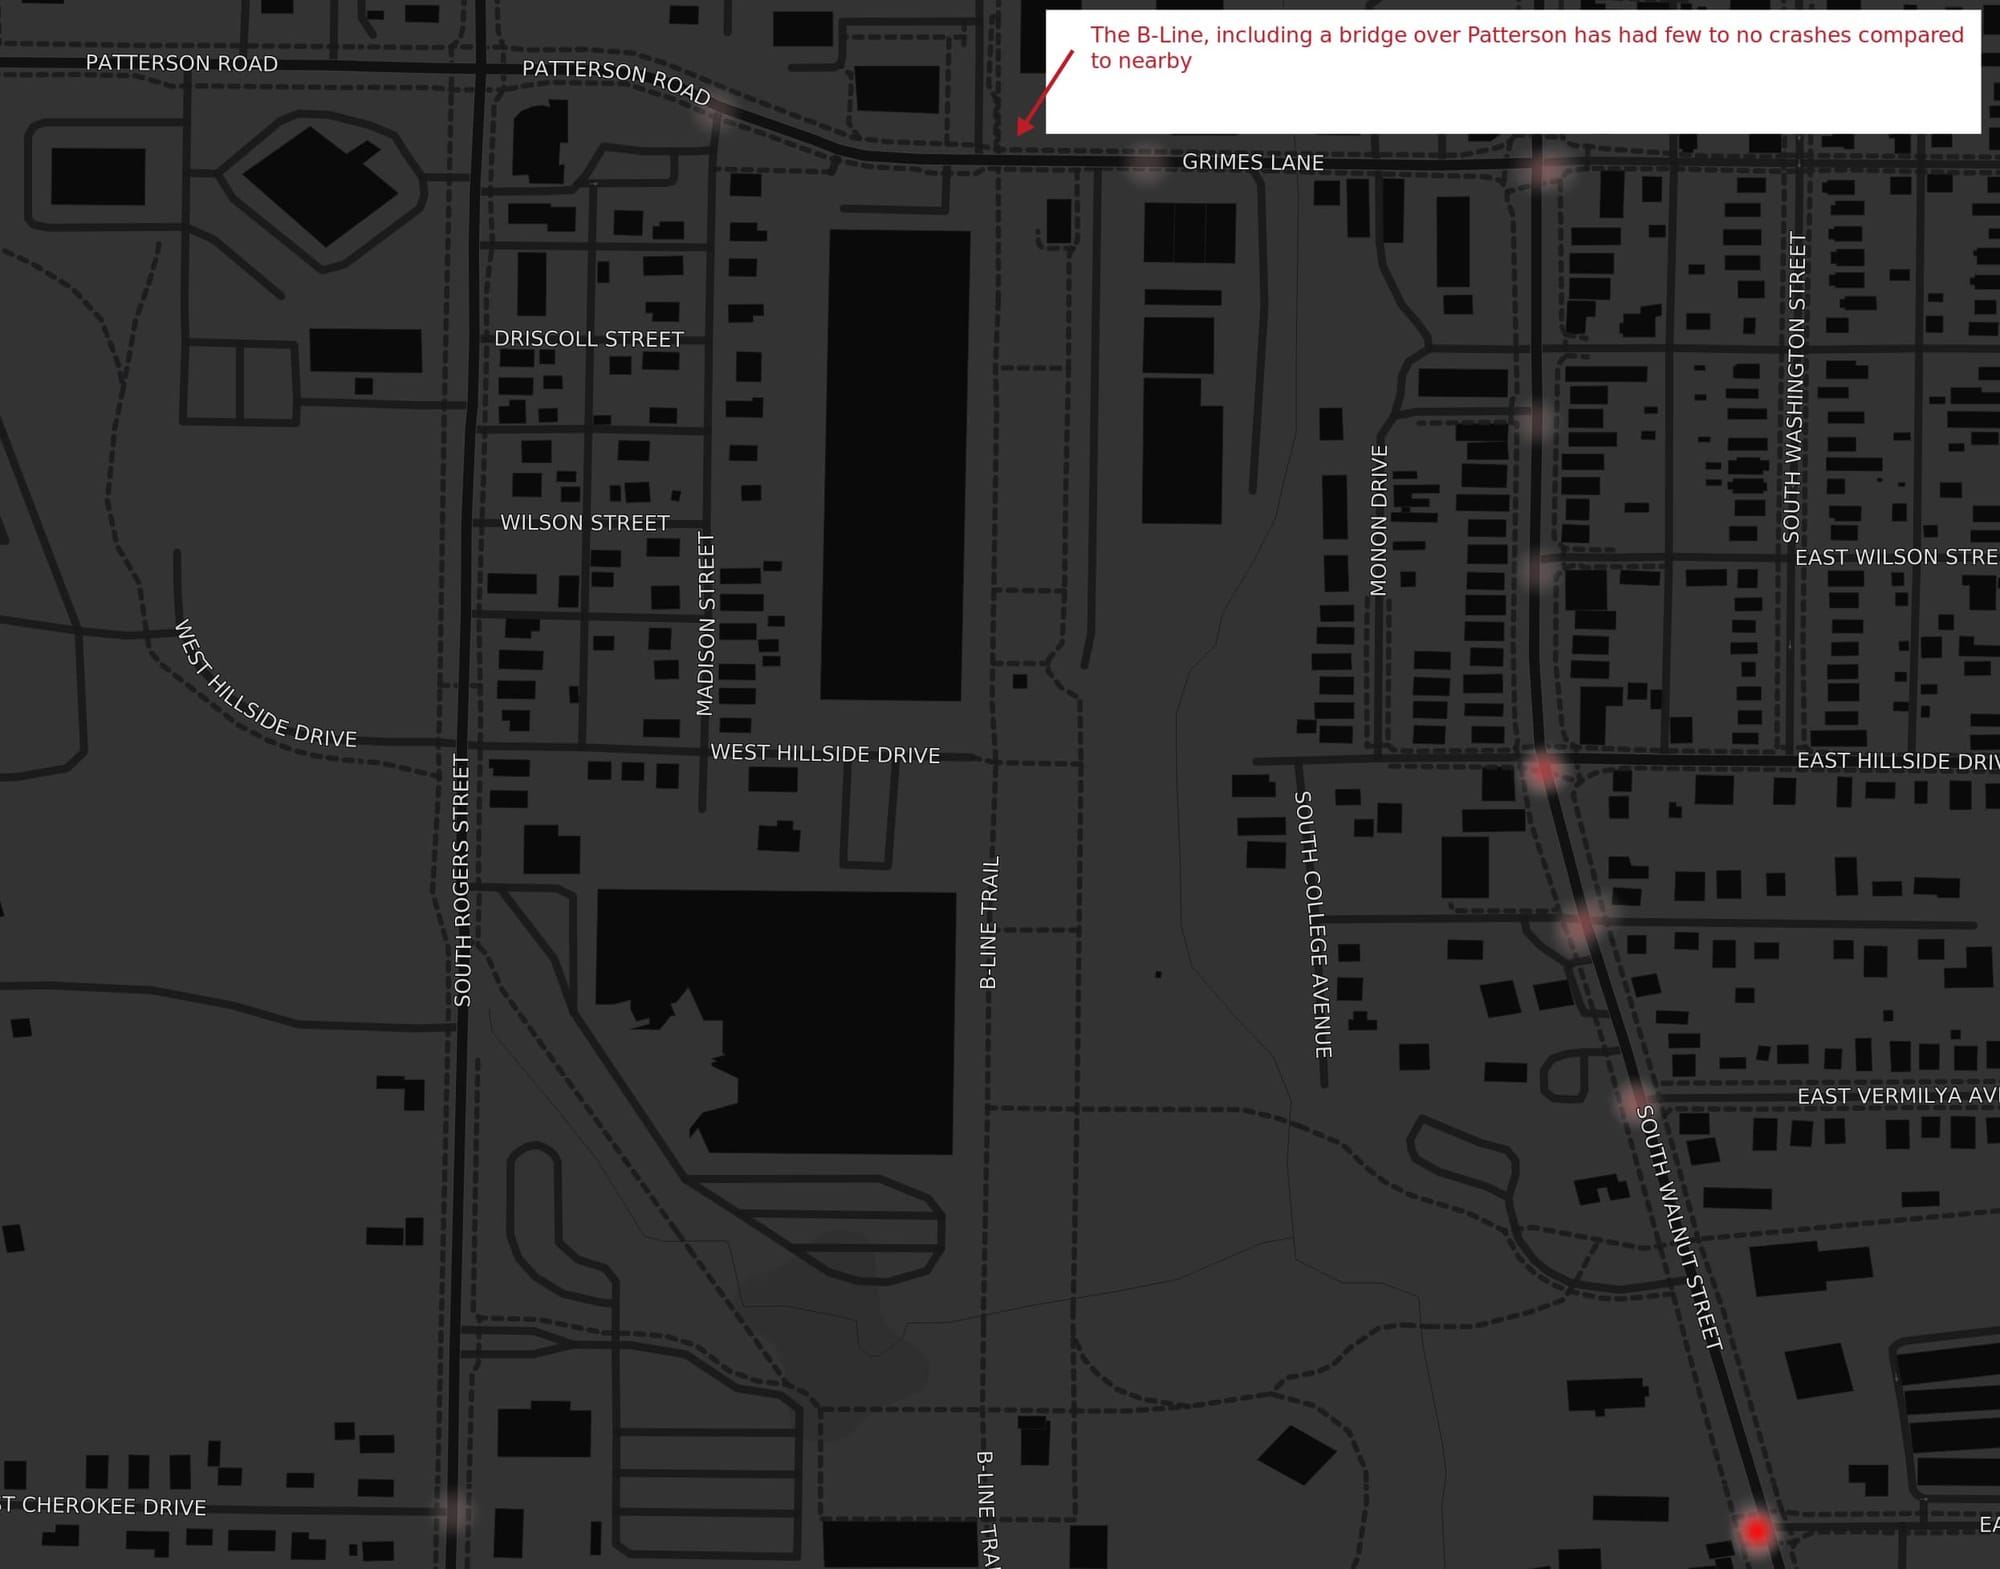
B-Line: More walking, less crashing
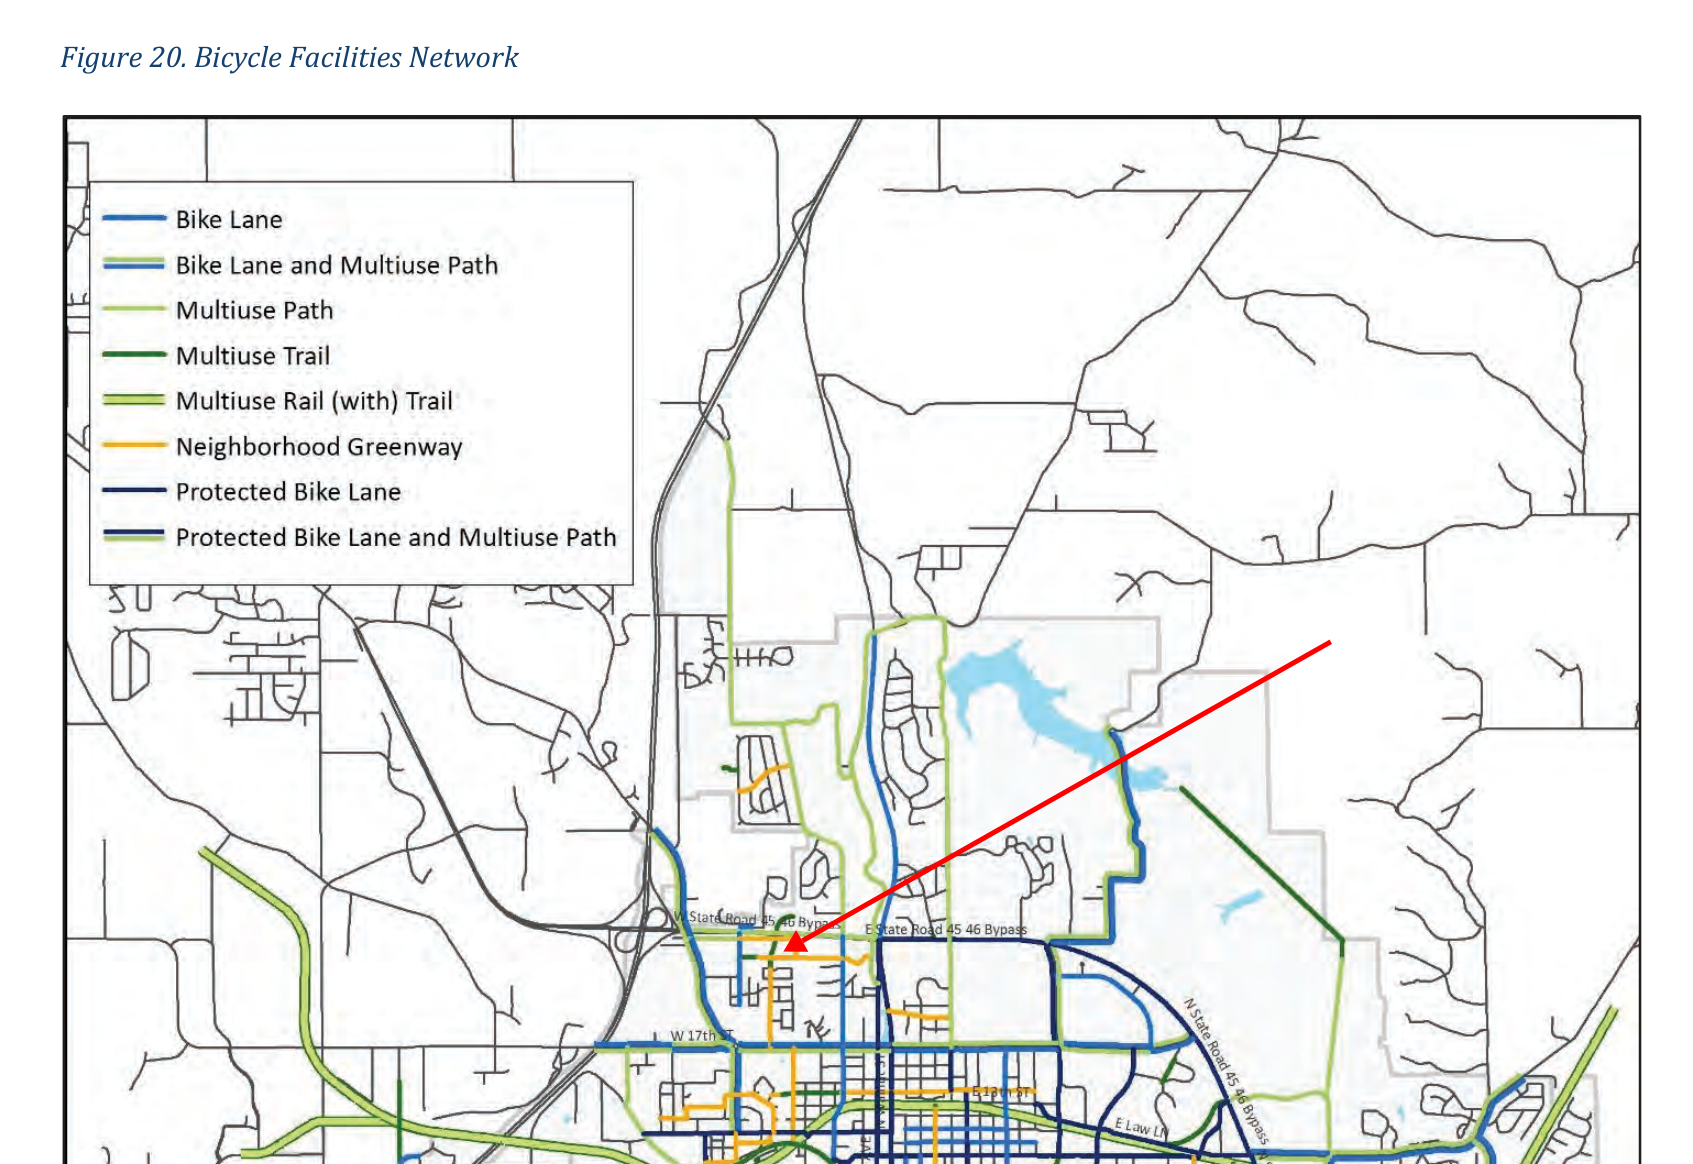
The B-Line carries more pedestrian traffic than many neighborhood roads handle in car traffic each day. A 2017 trail study measured B-Line daily traffic between 1,350 and 1,776 daily users. This next map illustrates the contrast between the lack of crashes as the B-Line crosses Grimes and through Switchyard Park, while there have been crashes at nearly every parallel intersection for the same walk down South Walnut. Removing conflict points with vehicles effectively reduces crash rates.
Crashes on Indiana University
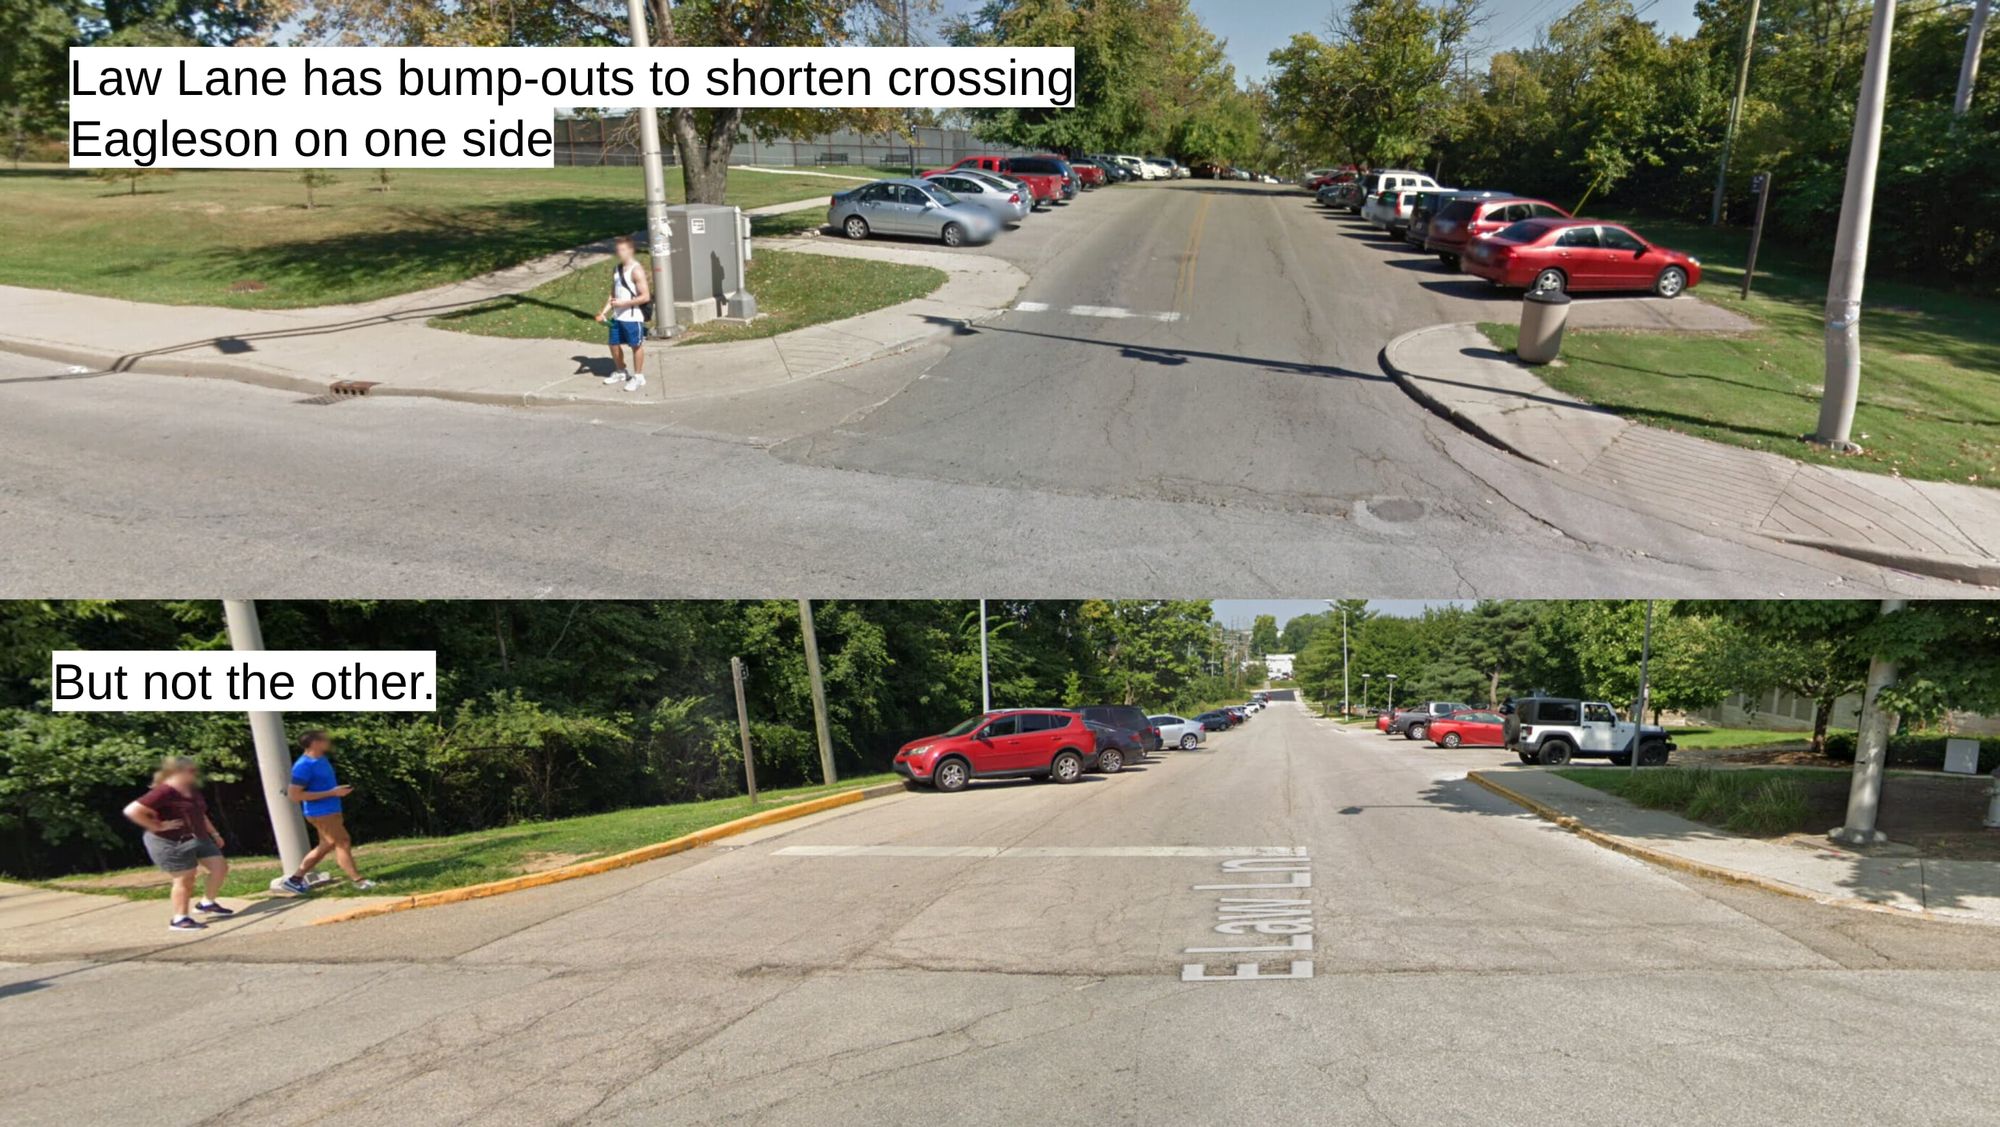
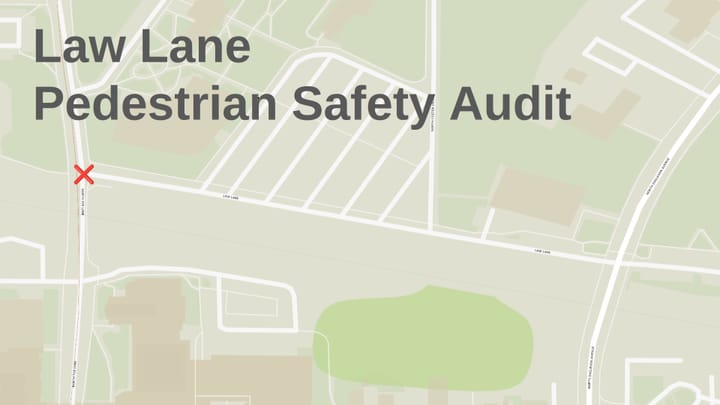
While we think of streets in Bloomington as the City's responsibility, the map highlights streets in green that are not maintained by the City. Those around IU are nearly all the responsibility of Indiana University. In the image above, the hotspot of crashes of Fee Lane and Law Lane is an intersection of a city street and an IU street.
Several other hotspots of pedestrian crashes involve IU streets. Here are several crashes along 10th Street where 10th intersects with streets maintained by IU.
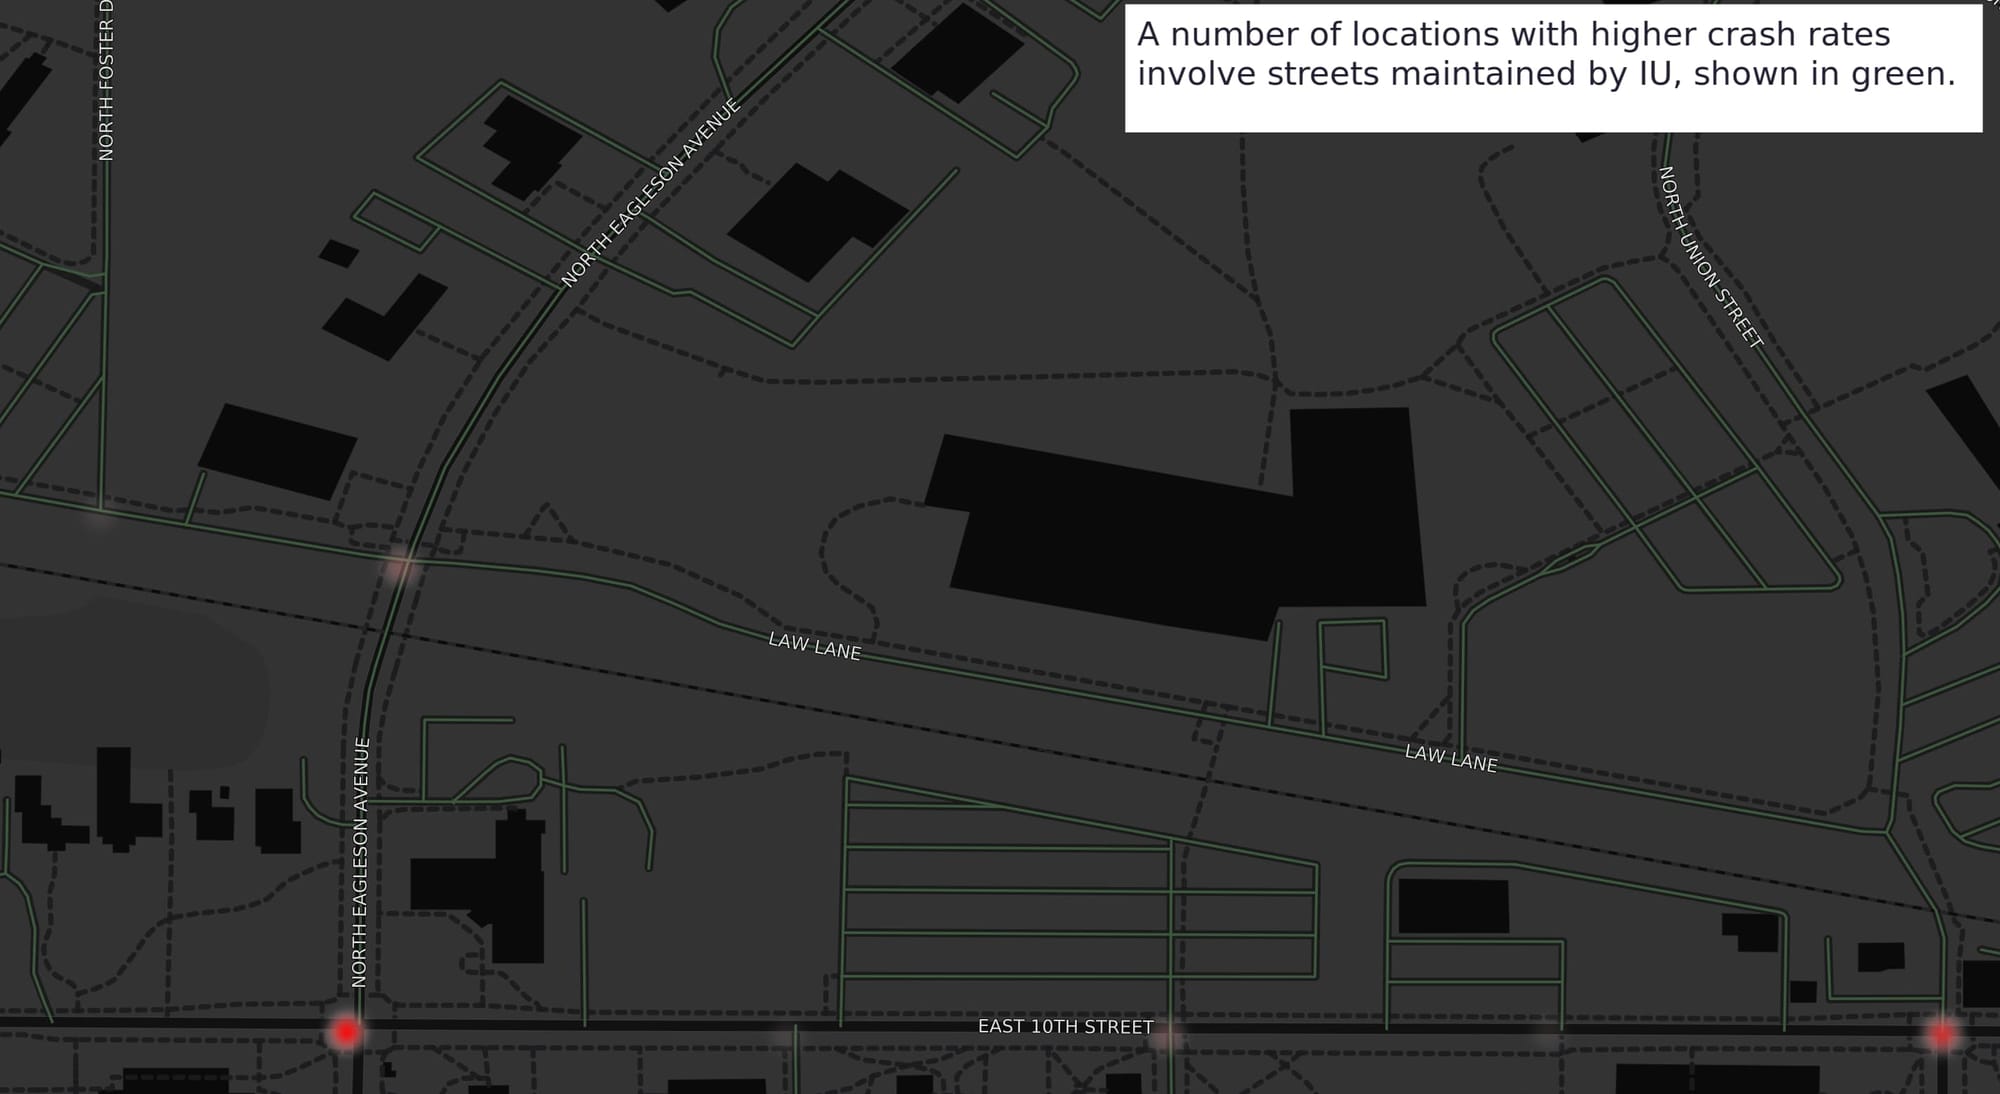
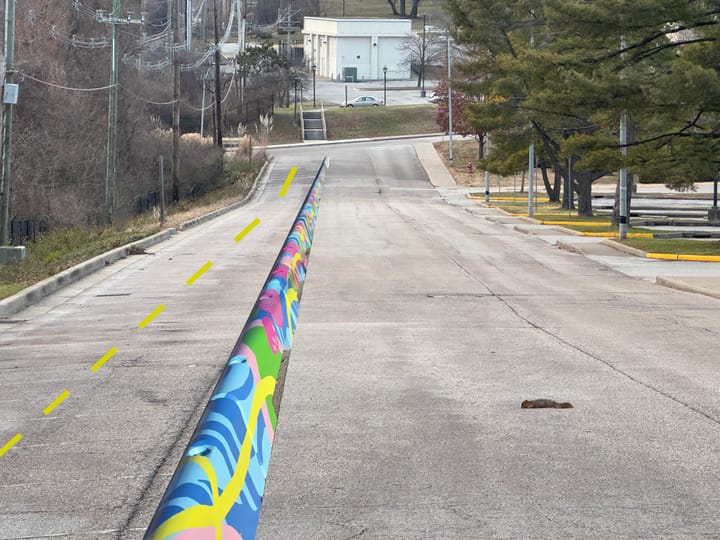
Above, notice intersections along Law Lane with crashes. These involve only IU-owned streets. There are design updates IU could consider to improve safety along Law Lane. For example, at the intersection of Eagleson and Law, a shorter, safer crossing distance is provided on the east side using bump outs, but on the west side of the intersection, the crossing distance for pedestrians is much longer.
A look at pedestrian crashes over time
Bloomington's pedestrian infrastructure has changed dramatically over the past 20 years, mostly for the better. The B-Line opened in 2009. More sidewalks and more multi-use paths have been built every year. Intersections that were dangerous before may become safer over time. Here's historical crash data summarized in a graph. The low counts in the first three years may be due to an alternate collection method. The crash rate has often averaged about one pedestrian-involved crash per week.
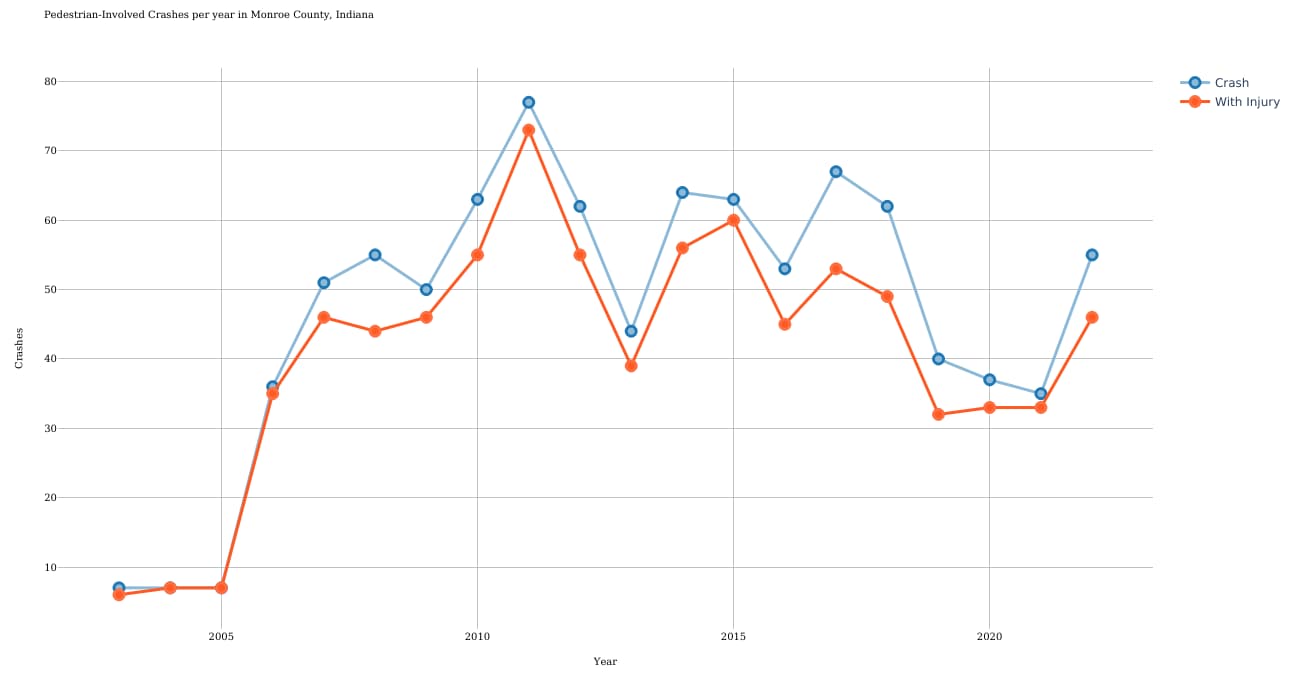
While the graph looks somewhat flat, the relative crash rate trend is expected to look a little better. Bloomington's population grew from about 72,000 to 80,000 during the same period. With facilities like the B-Line being added, it's fair to assume there's been a trend towards more walking.
Future challenges for pedestrian safety: bigger cars
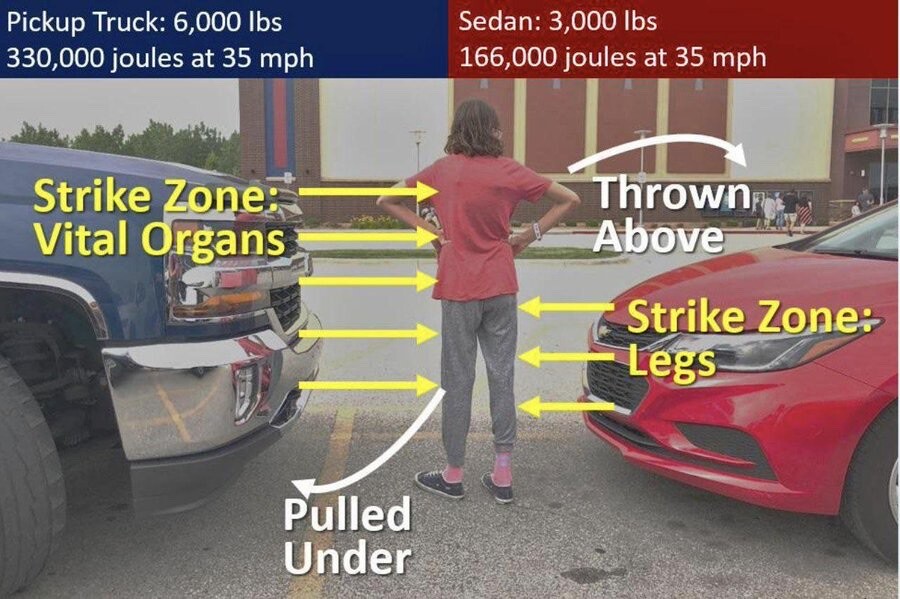
While Bloomington continues to improve pedestrian infrastructure, there's another trend that increases the likelihood of pedestrian fatalities: larger and heavier vehicles.
A new large truck can deliver about twice as much force on impact. It will knock people under the vehicle where they are more likely to die instead of throwing them on the hood.
While continuing to build better infrastructure, this threat may be best addressed with policies rather than updated street designs.
For a deeper dive into what's going on with bigger trucks, I recommend this video on the topic:
StreetsBlog covers the rise of large trucks along with the rise of pedestrian fatalities in the US, including in How Communities Can Fight Back Against Ever-Larger Cars and Trucks.
If Bloomington wants to curb the dangers of large vehicles to pedestrians it could:
- Consider weight-based registration fees.
- Create prioritized parking spaces closer to stores for all forms of mobility that are narrow or less than 8 feet (2.5 meters) long.
- Use posts or bollards to limit vehicle access so pedestrians, bikes, and smaller cars get priority
- Narrow travel lanes on streets to force traffic to slow down and free up space for wider sidewalks and bike lanes.
- Limit or end vehicle access to streets near schools and economically vibrant commercial districts, either permanently or at high-use times of the day.
Make decisions with data
Having an up-to-date heatmap of crashes is a valuable planning tool. It allows us to see pedestrian dangers at a city scale and focus on safety improvements where they can have the largest impact.
Unfortunately, the data I based this report on involved a one-time clean-up of the government's underlying crash data. The City or County could maintain an active dataset in a more usable format, but it would require process changes so the data stays up to date and usable.
Media Coverage
Indiana Public Media interviewed me and published coverage across their video, audio and online channels.
About the data and analysis
Crash data used for the post was taken from the Bloomington Open Data portal. Hopefully, in the future, our local government will provide up-to-date crash data in a more usable format than CSV.
Traffic volume data (aka AADT) was based on 2019 and 2020 data sourced from the City of Bloomington.
The map of non-city-maintained roads was created by comparing Bloomington's published data for "City-maintained Streets" with all the streets available on OpenStreetMap. Using Overpass Turbo, a query for streets like (way({{bbox}})["highway"~"^(residential|secondary|tertiary|unclassified|road|service)$"];>;); was performed.
To calculate the top crash locations, crashes with 250 feet of each intersections were considered. In cases where there were more than intersection within that radius, the closest intersection was considered. Detailed notes about the method are published at Intersection Crash Analysis with QGIS.
The free, open-source QGIS app was used to bring the data layers together and visualize the data.
Update December 2024: An earlier version of this post was based on crash data processed by the Indiana Daily Student. I later discovered a flaw in their processing method which caused excessive crashes to be attributed to the Kirkwood and College intersection as well other data accuracy issues. I re-ran the entire analysis based directly in the city's crash data. This ultimately produced largely the same top intersection intersections and corridors.

Comments ()