How Ann Arbor used spatial analysis for sidewalk prioritization
Ann Arbor, Michigan got a lot right in their efforts to build out their sidewalk network in an objective and equitable way.
More funding: a larger pie
First, they not only considered how to slice a funding pie more fairly, they raised money for a much larger pie of funding through an additional tax approved by voters.
According to their New Sidewalks FAQ:
... voters approved a six-year New Sidewalk Millage, which will generate approximately $1.3 million per year, to be used exclusively for sidewalk gap filling projects.
For comparison, my city of Bloomington, is slightly smaller and spends more like $350,000 on sidewalk gaps, funding through parking meter feeds.
Including public input in a measured way
Ann Arbor factored in public input along side many objective criteria. In this process, the final priority is not dominated by what people complain about nor ultimately decided by politicians.
Residents should complain when their government isn't working for them, but a system that is primarily complaint-driven is biased towards people who have time to complain and those who believe the system will work for them. Residents deserve good sidewalks funded in a objective way whether they complain or not.
Ann Arbor describes the public engagement part like this:
The city developed a prioritization system for all the locations in the public right-of-way where sidewalks do not currently exist. The system considers such factors as: proximity to schools, transit, and other pedestrian attractors; equity; classification of adjacent road; community support/citizen requests; and safety.
Since citizen requests are one of the criteria to prioritize sidewalk gaps, if new sidewalk is desired in an area, a written/digital request may be submitted which may help move the location forward in the prioritization. This criteria is scored such that submitting a petition for the desired project will earn more points depending on the number of signatures, as follows:No requests (0 points)A single request (2 points)A petition submitted by 2-9 households (5 points)A petition signed by 1-20 households (8 points)A petition signed by 21+ households (10 points)
Transparency
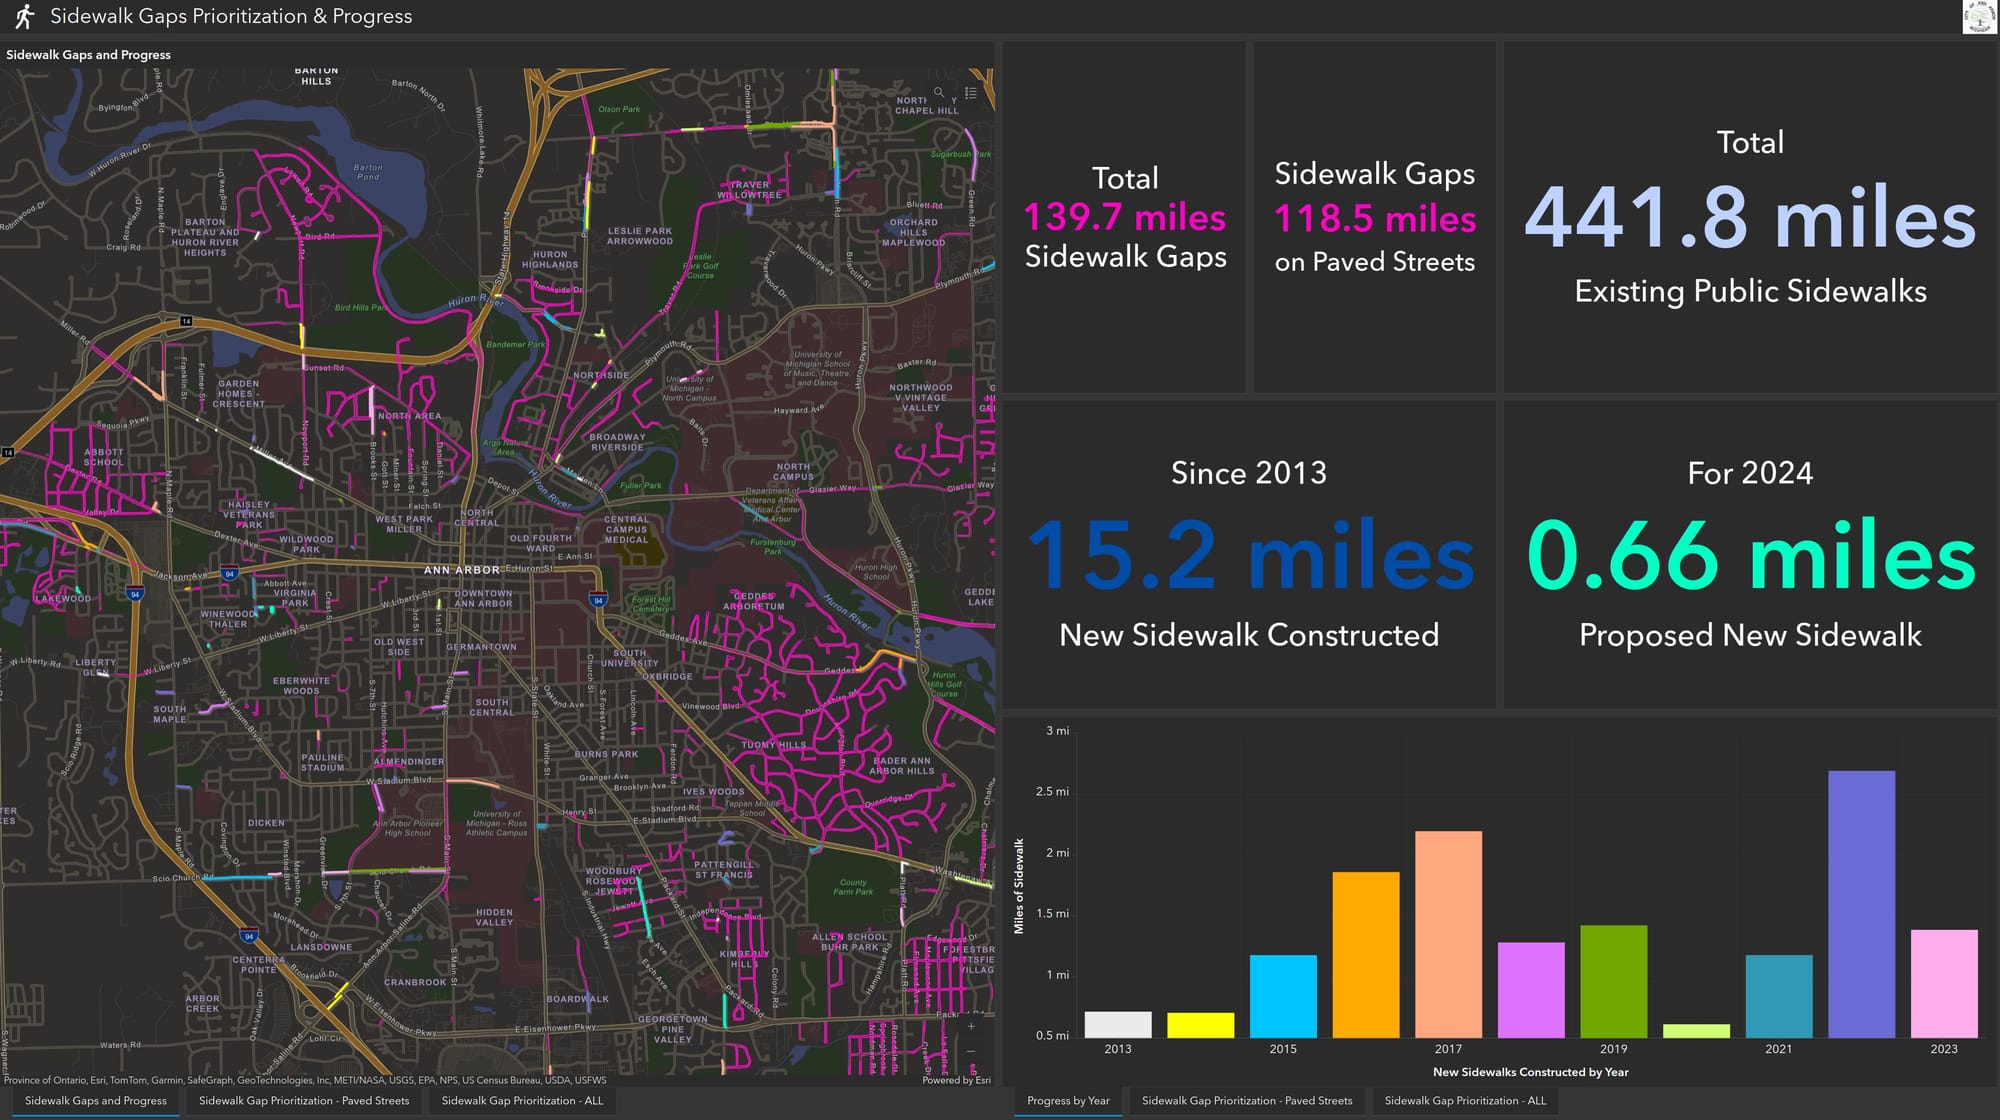
For transparency, Ann Arbor built an online dashboard where progress could be tracked. Click to see the live version.
Ann Arbor published the details of their Analysis Methodologies.
Good now, better later
When their analysis identified important gaps but they lacked funds for an immediate fix, they made short-term stop-gap plans to make these important connections safer sooner. They describe their interim solution like this:
Where sidewalks cannot be constructed on a reasonable schedule, gaps in sidewalk coverage can be filled by providing interim sidewalks at the grade of the street, using physical separation elements such as parking stops, edge markings, and pavement color and/or texture. This approach could be applied to lower priority gaps so that safety is improved in the short term while waiting for permanent upgrades.
Using that method, they planned to fill in 10 miles of near-term gaps within three years.
Calculating sidewalk equity
There is not one magic formula for calculating equity for use in transportation planning. The best solution depends on the context and history of your city, as well as the best metrics that are available for the task at hand.
When it comes to to sidewalk equity, there are certain demographic metrics that are signals that a sidewalk is more likely to be used. For example, if you are too young or drive. And past a certain age, it becomes less likely have or use a driver's license as well.
If you don't have or can't afford a car, those are also good signals you are more likely to use a sidewalk.
In Bloomington, I performed a sidewalk equity audit which among other things used the Spatial Equity Data Tool to compare how our current sidewalk distribution compared to demographic metrics. Using a process like that, you can find out if you may have under-prioritized areas of the city with more renters or lower-incomes for example.
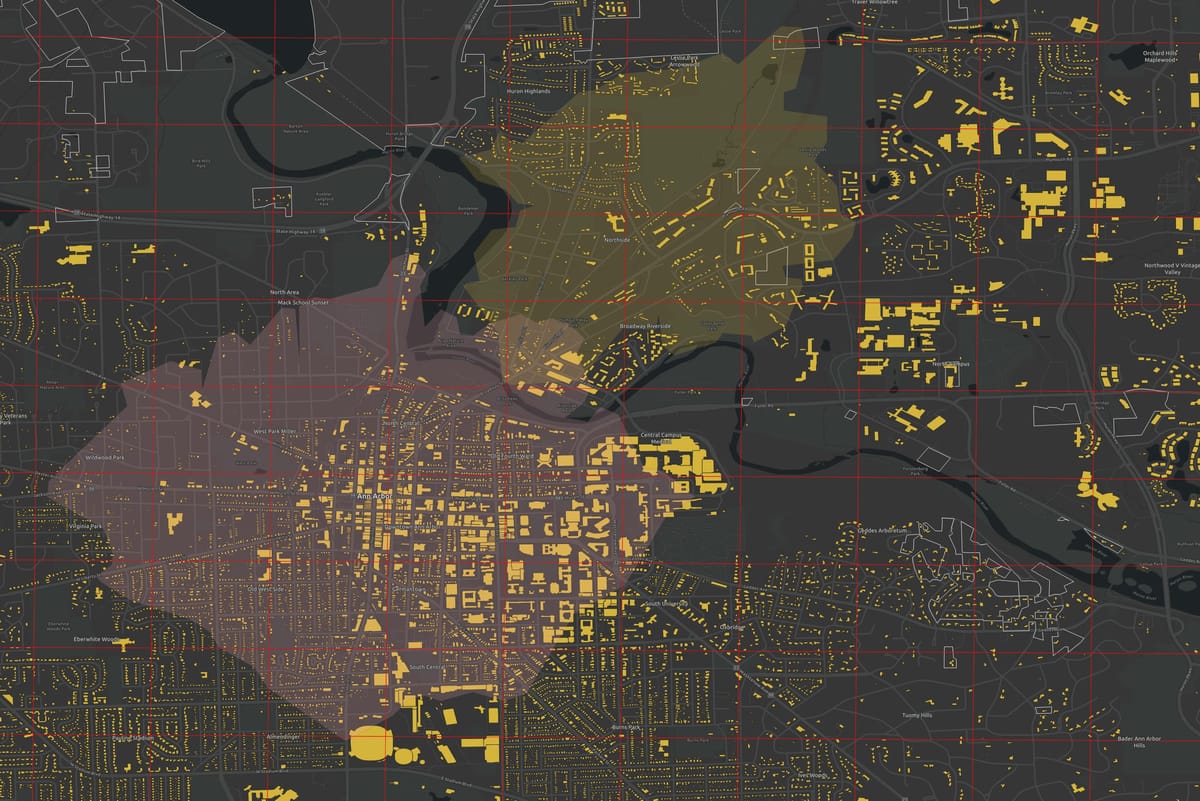
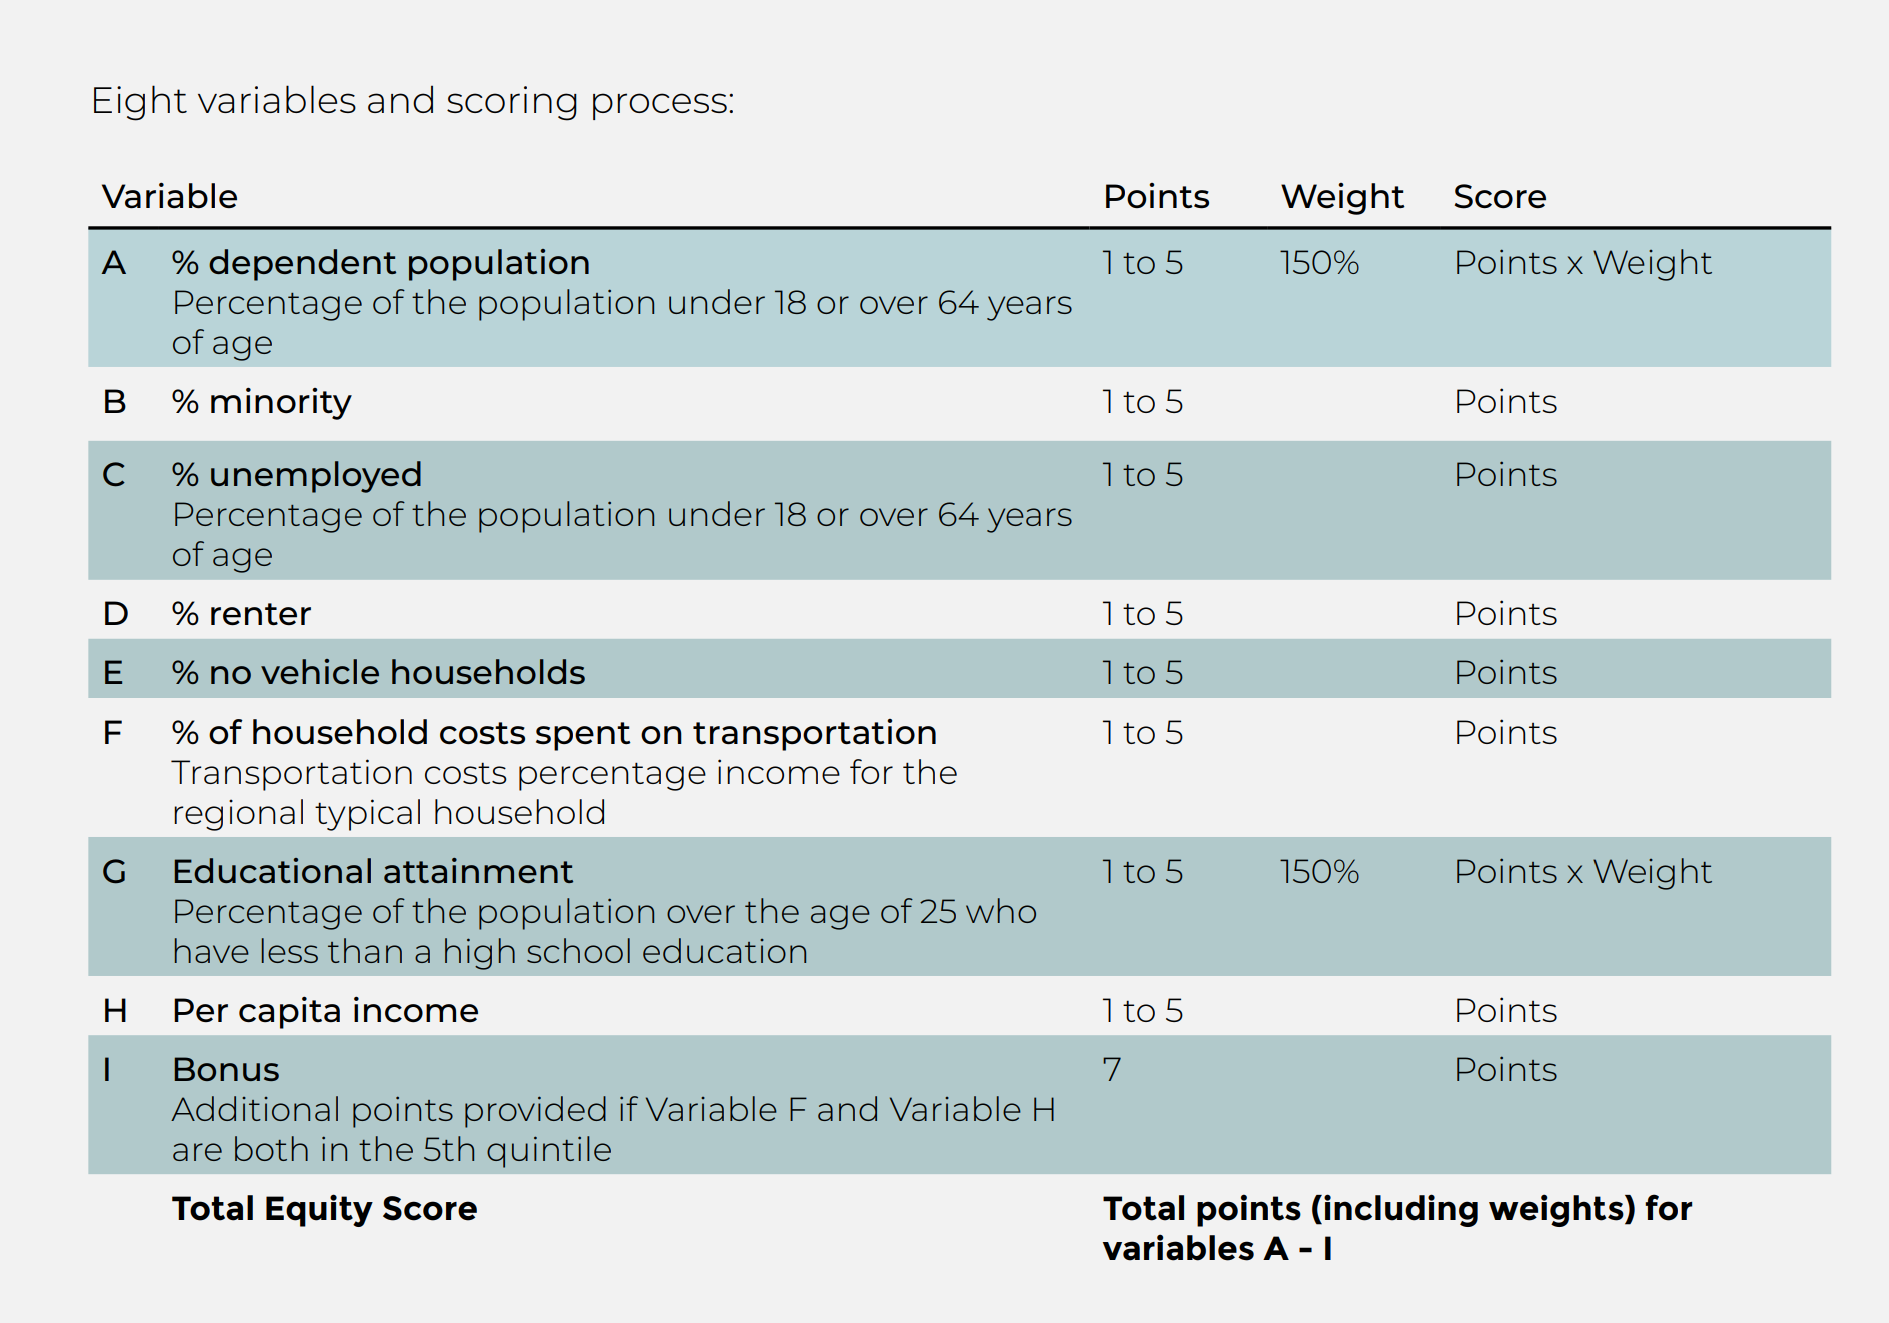
Here's how Ann Arbor put together their equity score for prioritizing sidewalks:
Quantifying Pedestrian Demand
Ann Arbor developed their own Pedestrian Demand Index. They describe the ingredients like this:
Population characteristicsPopulation (2016 ACS) (10 points)Zero-vehicle households (2016 ACS) (8 points)Low-income households (2016 ACS) (8 points)Older adults (2016 ACS) (5 points)Children (2016 ACS) (5 points)EmploymentTotal jobs (LEHD 2015) (10 points)EducationSchools (City dataset) (10 points)Universities (City dataset) (10 points)Land useParks + open spaces (City dataset) (3 points)Grocery stores (developed layer using Google Places) (3 points)Shopping + hotel + downtown parcels (selected relevant parcels from City land use dataset) (20 points)Public libraries (City dataset) (3 points)TransitAAATA Bus Stops (AAATA dataset 2018) (5 points)Each factor was indexed to the prescribed point scale. All factors were then summed to determine the final pedestrian demand score.
That description comes from their Analysis Methodologies PDF.
By comparison, the Walk Potential metric I developed has a more complex calculation concerning land-use, factoring in about 20 categories of amenities. The other variables that Ann Arbor factors can still be considered alongside Walk Potential by using the method of joining all the variables on a hex grid, as described below.
A benefit of Ann Arbor's method is that it directly attaches the score to street segments in the GIS data. In the hex grid approach I use, scores are attached to the hex grid. An additional step can be used at the end to analyze which street segments intersect the hex grid to relate any scores assigned to the hex grid back to street segments.
The transit connection
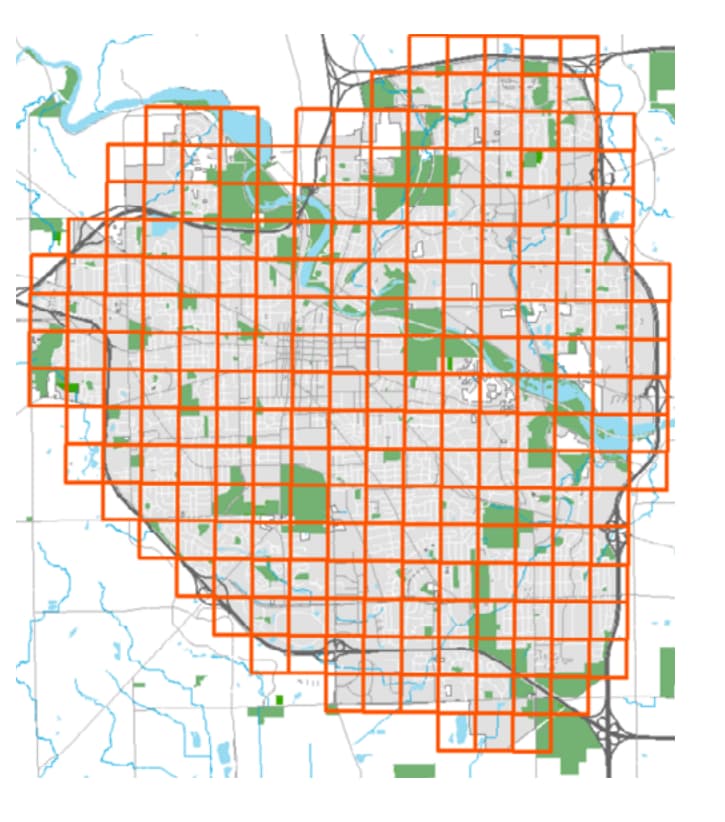
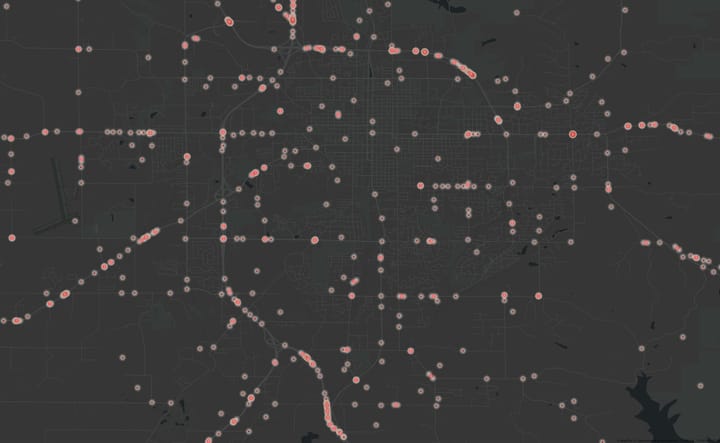
One the criteria that Ann Arbor uses is access to transit– the proximity to bus stop of a sidewalk gap. To support that, they divided the city into 235 quadrants 2,000 feet wide, and analysis to find all the jobs within 20 minutes by car and by transit in those locations. Here's what the grid looks like:
That spatial analysis revealed following in the 2021 Ann Arbor Transportation Plan:
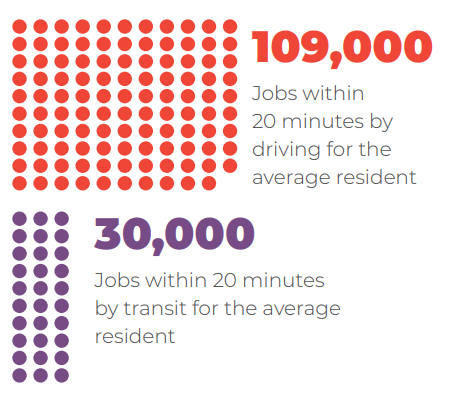
Today, people living in Ann Arbor who drive have superior access to jobs compared to the 12% of households that don’t have access to a vehicle and those that rely on other modes of transportation. The average resident can reach 109,000 jobs in the city within a 20-minute drive, while the average transit user has access to 72% fewer jobs (30,000) within 20 minutes.
One way to address that equity gap is by ensuring there sidewalks within walking distance from bus stops.
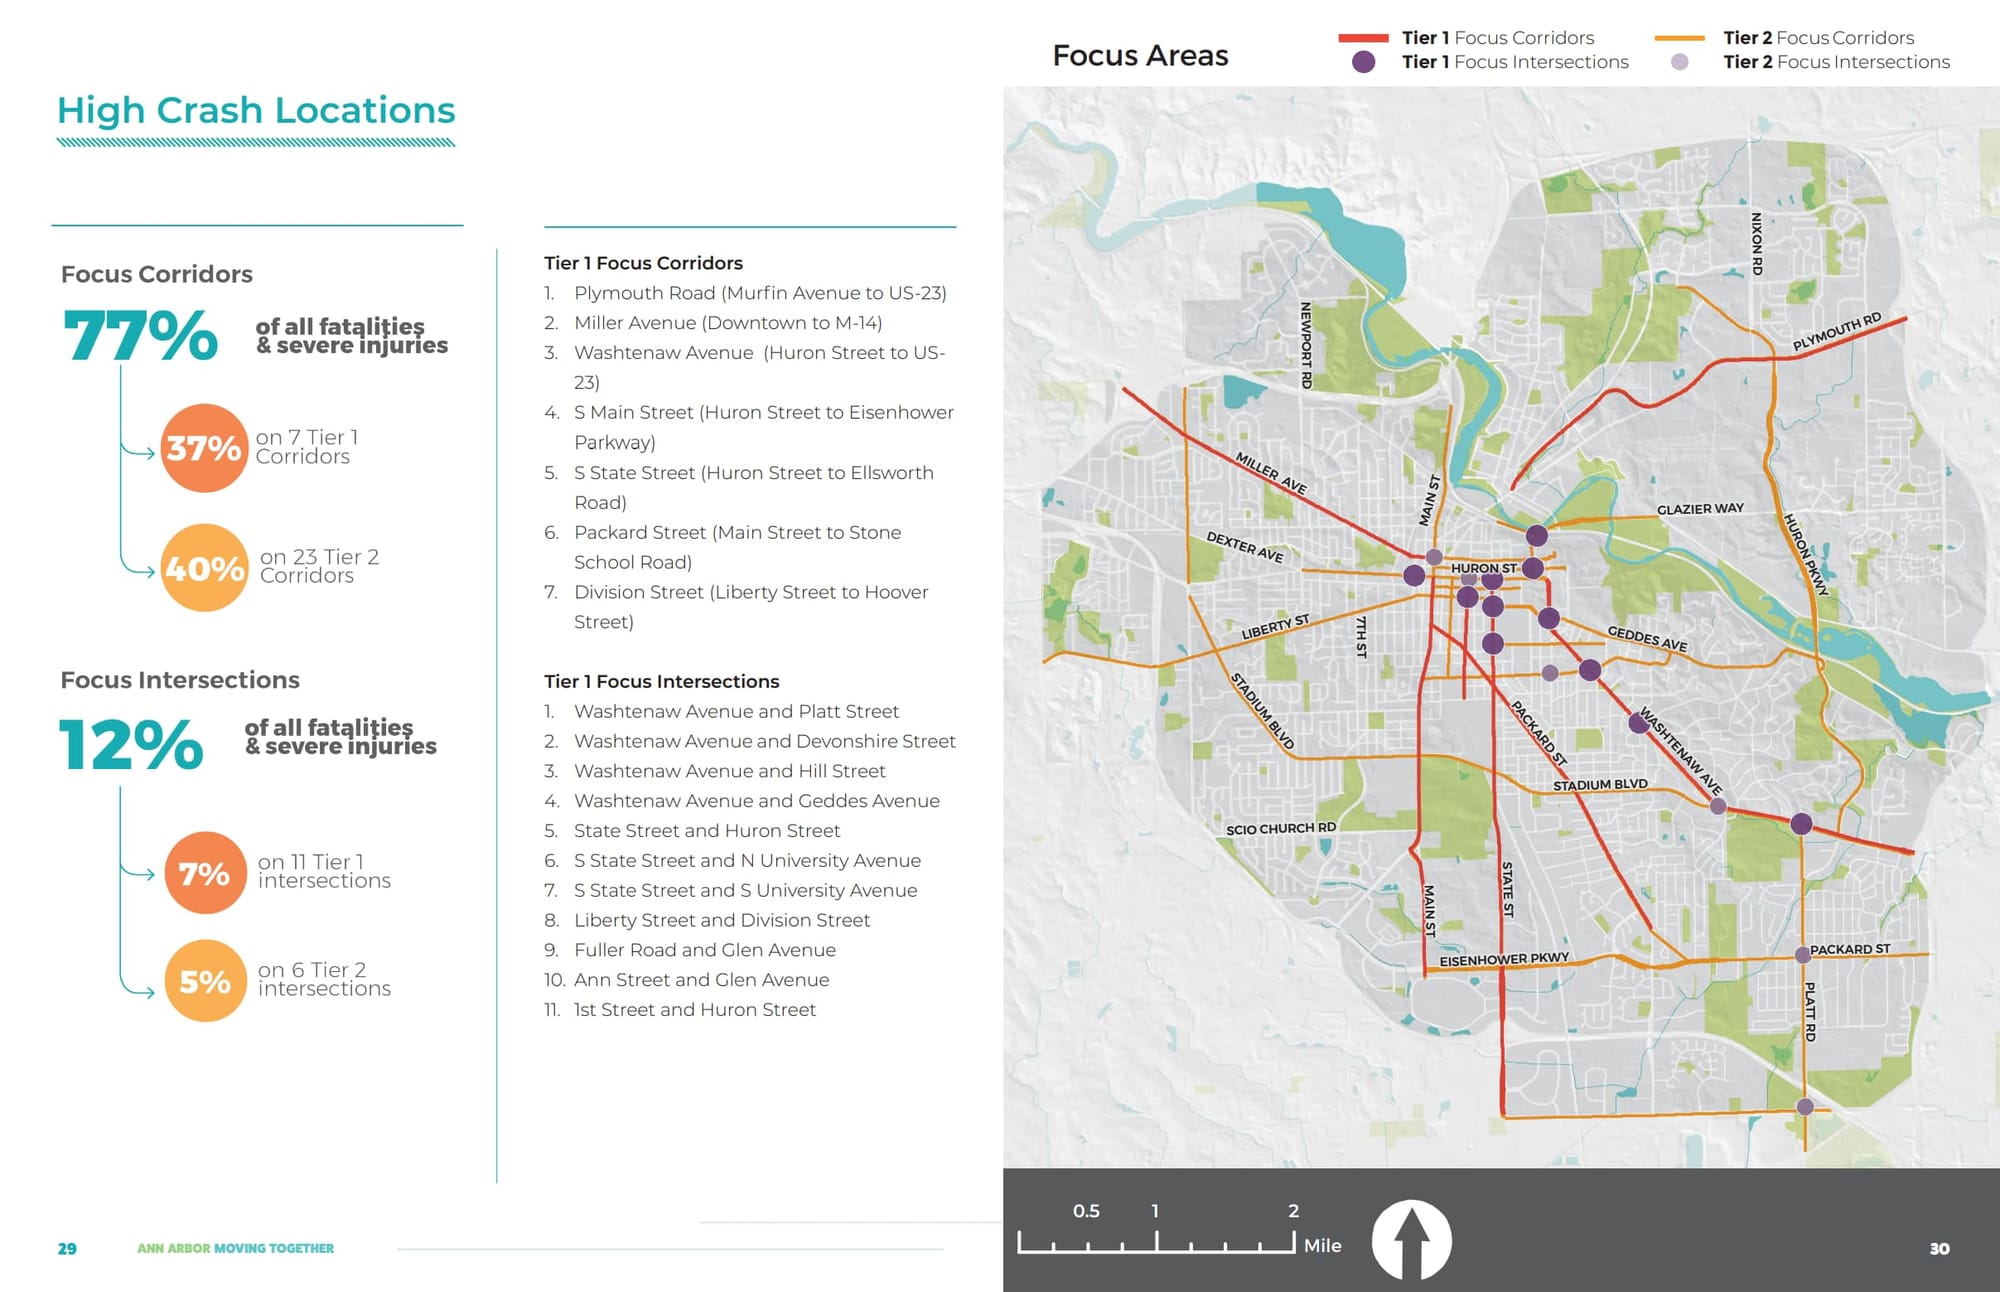
Dangerous Intersections and Corridors
Ann Arbor used spatial analysis to find both intersections and coordinators with a history of higher crash rates, so efforts can be made to prioritize safety along these objectively more dangerous locations.
Metrics to measure success
Measuring progress helps keep a big progress on track. To that end, Ann Arbor quantified a number of metrics that could be measured track progress towards their Vision Zero goal:
Safety Metrics
- Annual number of people killed or seriously injured in traffic crashes
- Share of serious injuries and fatalities incurred by people walking and biking
- Share of serious injury and fatality crashes related to dangerous driving behaviors
- Number of safety improvements installed on focus corridors and intersections per year
Mobility Metrics
- Population within a ¼ mile of the all ages and abilities bicycle network
- Population within a ¼ mile of high-frequency transit (every 15 minutes)
- Share of trips in the city made by walking, biking, and transit
- Shared mobility vehicles available (car share, bike share, e-scooters)
Accessibility for All Metrics
- Transportation costs as a percent of household income
- Average number of jobs within 20 minutes via different modes
- Share of bus stops that are ADA accessible
- Miles of gaps in the sidewalk network
Healthy People & Sustainable Places Metrics
- Average vehicle miles traveled (VMT) per day - Share of the population living in 20-minute
neighborhoods - Share of the population meeting physical activity guidelines
Regional Connectivity
- Share of commute trips into/out of Ann Arbor on transit
- Number of go!pass (or equivalent citywide program) holders
Room for improvement?
Publishing more details and code
I would have liked to see an even more detailed description of their method of prioritizing sidewalk locations. If not code-level detail, that at least how the much percentage each factor of their prioritization score contributes to the total. I found some references to many "points" some things scored, but I could not find any the general formula for all the points fit together.
Another level of transparency would be publishing the code and data involved to public Github repo or open data portal for public access and peer-review.
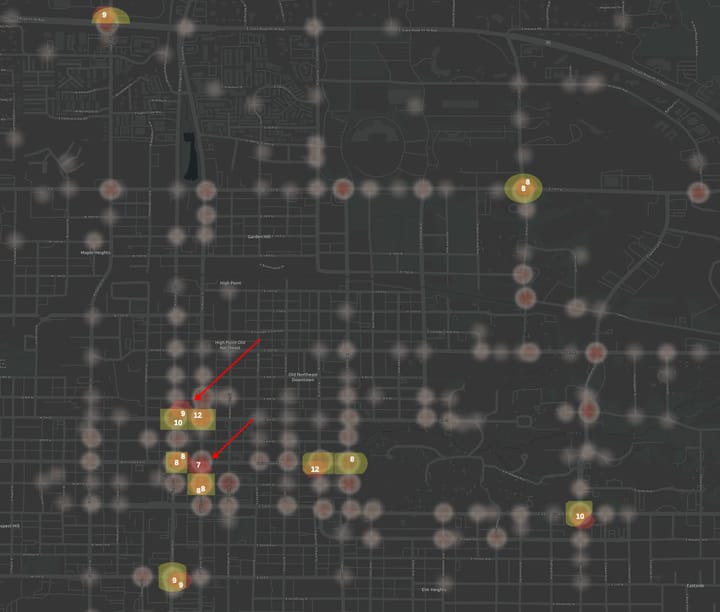
Use a more granular grid
Ann Arbor used a grid with 235 squares for calculating access to jobs, as seen above. A grid with smaller cells could have been more precise. But in context, the analysis was used to confirm that those was cars had more access to jobs then those who did not– something that would be true today at almost any grid size.
Use a hex grid
Using a hex grid instead of a square grid would reduce orientation bias. Square grids can introduce an artificial bias due to their alignment with cardinal directions. That is, square grid may perfectly align with east-west and north-south streets in some places, causing oddities in transportation analysis. Hex grids are are more likely to intersect the transportation network.
Summary
Overall, Ann Arbor has done a strong job with their Vision Zero and sidewalk priority efforts, at least as seen remotely. Explore their pages more on your own through this link
Comments ()