Sidewalk Priority Toolkit
Given limited funds for building and repair sidewalks, where the's optimal place to find them? Ideally, we'd like to factor in the potential demand for the sidewalk, how it might improve safety, and equity. The solution should be comprehensive– considering all locations in a city. It should be objective.
Spatial analysis toolkit for sidewalk equity
After the sidewalk equity audit was published, the City of Bloomington agreed to move towards a more objective and comprehensive way to prioritize sidewalk locations to fund. To do that, they needed to update their toolkit to prioritize sidewalk locations to fund. What follows are metrics I generated with a spatial analysis to support that effort.
The metrics have been packaged for easier user in QGIS plugin called Sidewalk Priority Toolkit.
Building a missing sidewalk map
For a comprehensive view, the first thing is that you need to know where all your missing sidewalks are. If your city is already hiring a vendor to create a LIDAR scan of all your sidewalks– great– than they may sell a "missing sidewalk map" as a byproduct of that work. Otherwise, you can create one yourself using the map of the road network and a map of the sidewalk network.
I already have a post dedicated to this topic, so see:
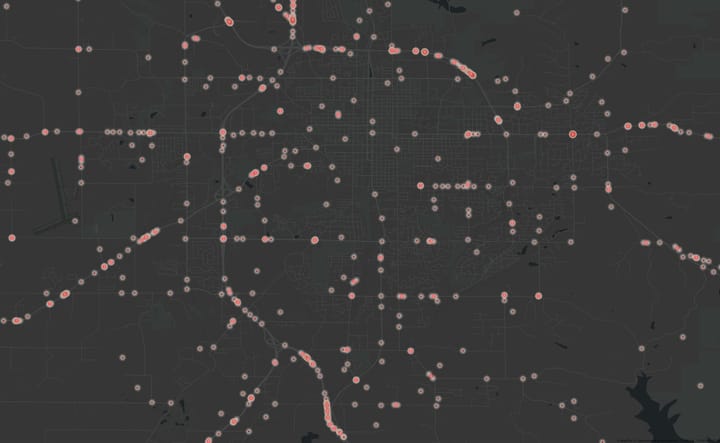
Mapping pedestrian demand with a "Walk Potential" metric
If you build it, will they come? The more sidewalk will get used, the better investment it is. But how can pedestrian demand be predicted, objectively and comprehensively across a city?
We know that pedestrians prefer if all the destinations they'd like to walk to are within about a 10 minute walk. And we know the kinds of categories of destinations that might be included in 10-minute neighborhood. Grocery stores, coffee shops, schools and businesses in general. All this data is already in OpenStreetMap, available to be queried. By using some code, pedestrian demand can be modeled across a city. I created a metric called Walk Potential that does this. I have a dedicated page about that as well, see:
My Walk Potential software is free, open source, and cities are able to adapt the definition to their city as they like.
Some cities have used the commercial "WalkScore" metric. Not only is it expensive, but it is a black box that can't be peer-reviewed for corrected or inspected to see what biases it may contain by the types of destinations it considers interesting destinations for walking vs those it includes.
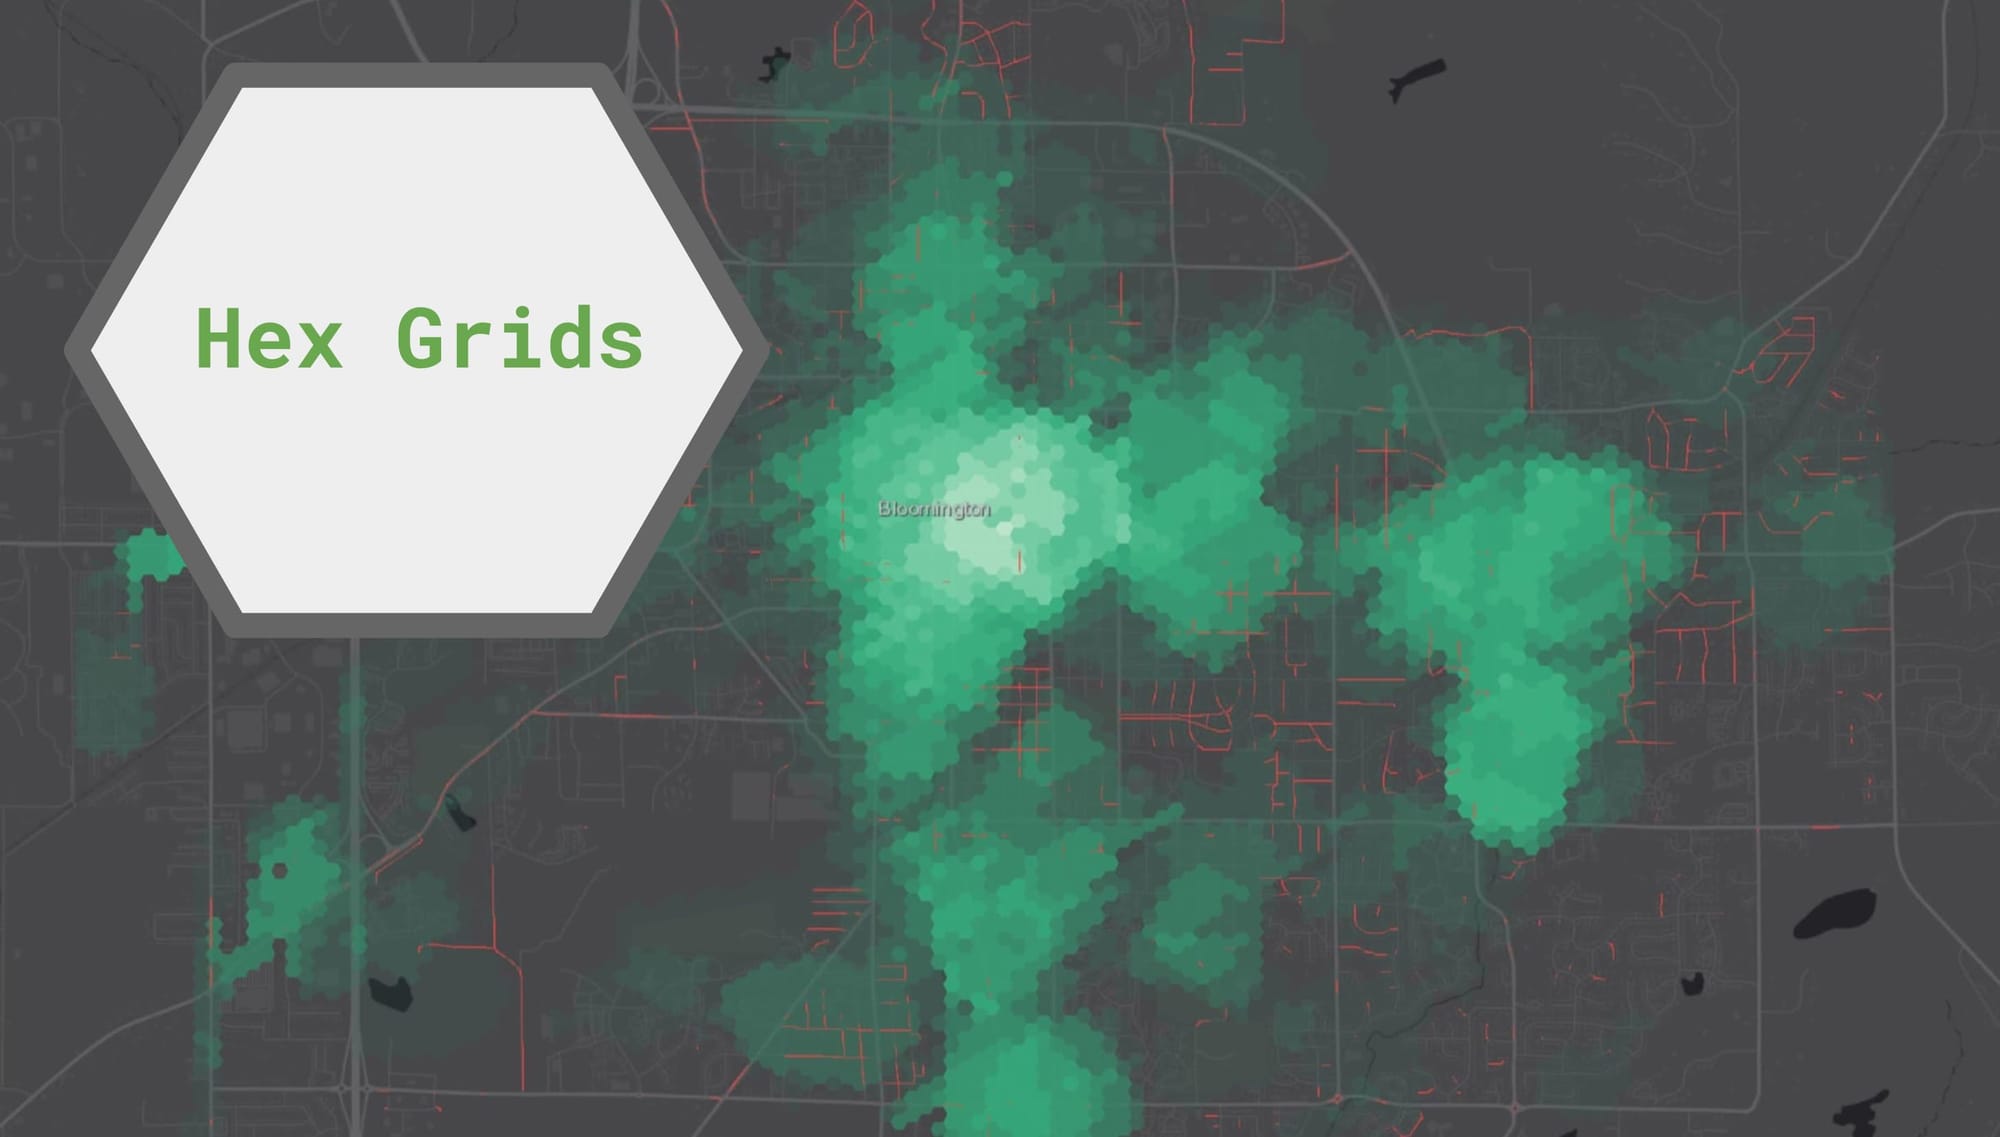
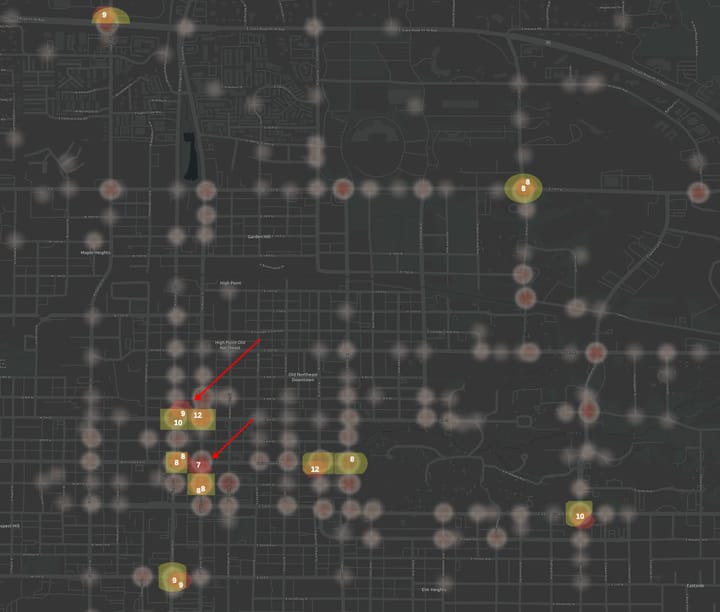
Using hex grids to combining a diverse range of metrics to build a final priority score.
There's a need to bring a number of metrics together to create a weight priority:
Something that may factor in the "walk potential" of area and equity, but also safety variables, so the most dangerous areas can be fixed first. How fast is the street? How wide is the street? How many crashes have happened there? Is there a bus stop nearby? Then there are demographics to consider. What's the income in the area? The primary mode of transportation? The rate of car ownership? All of these could be interesting to consider.
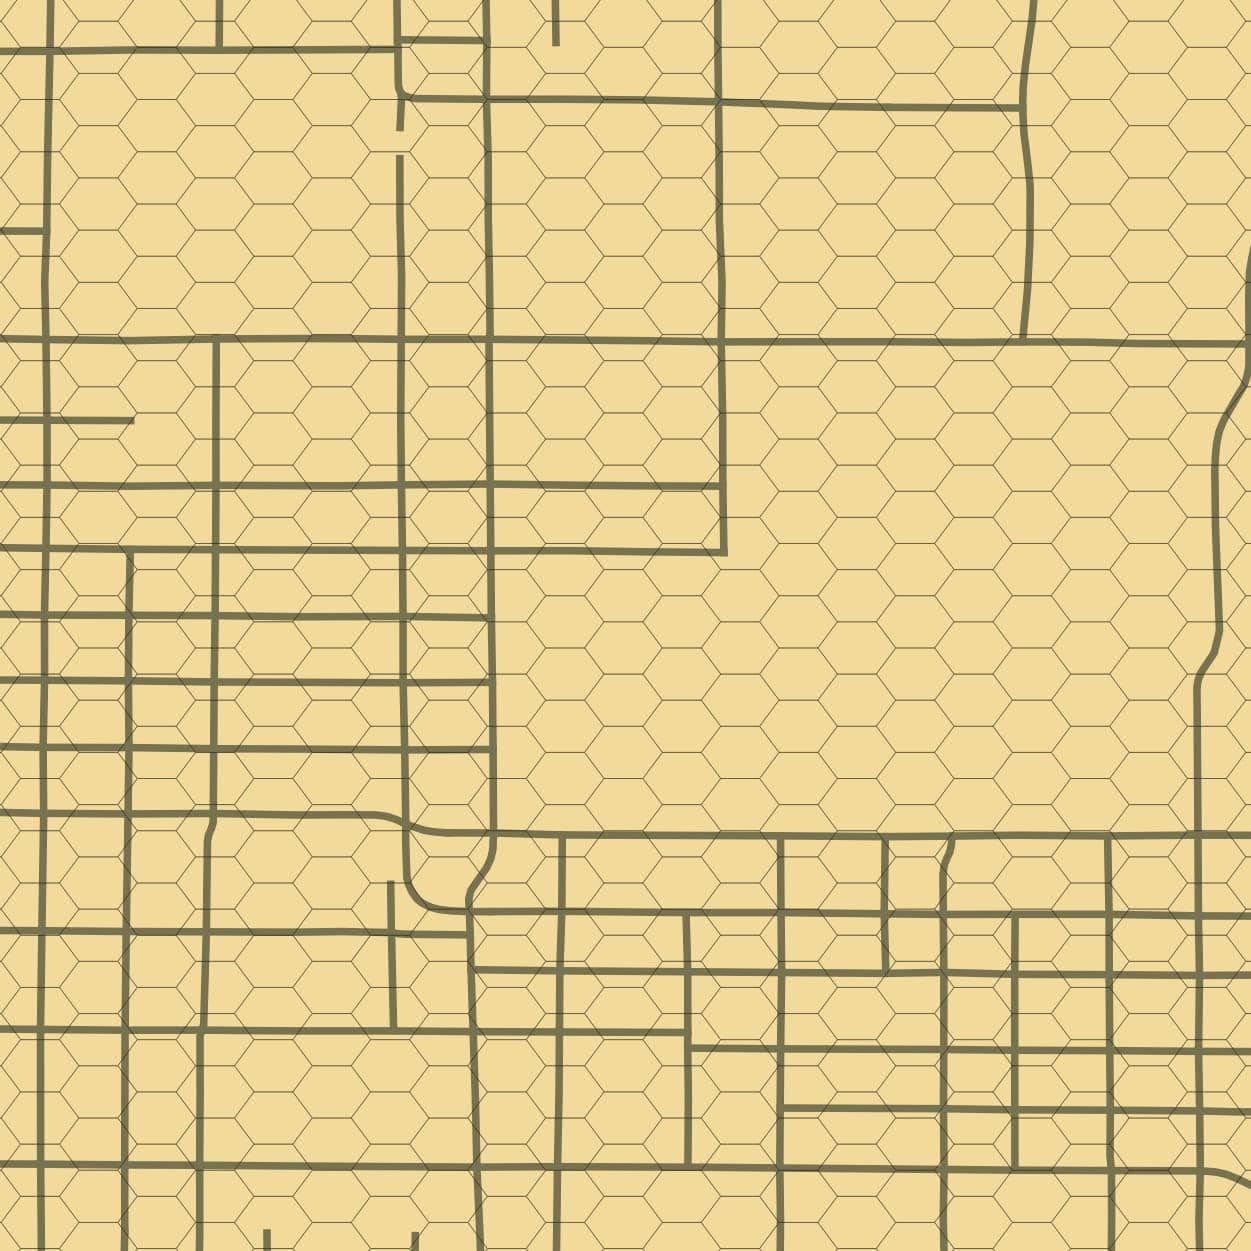
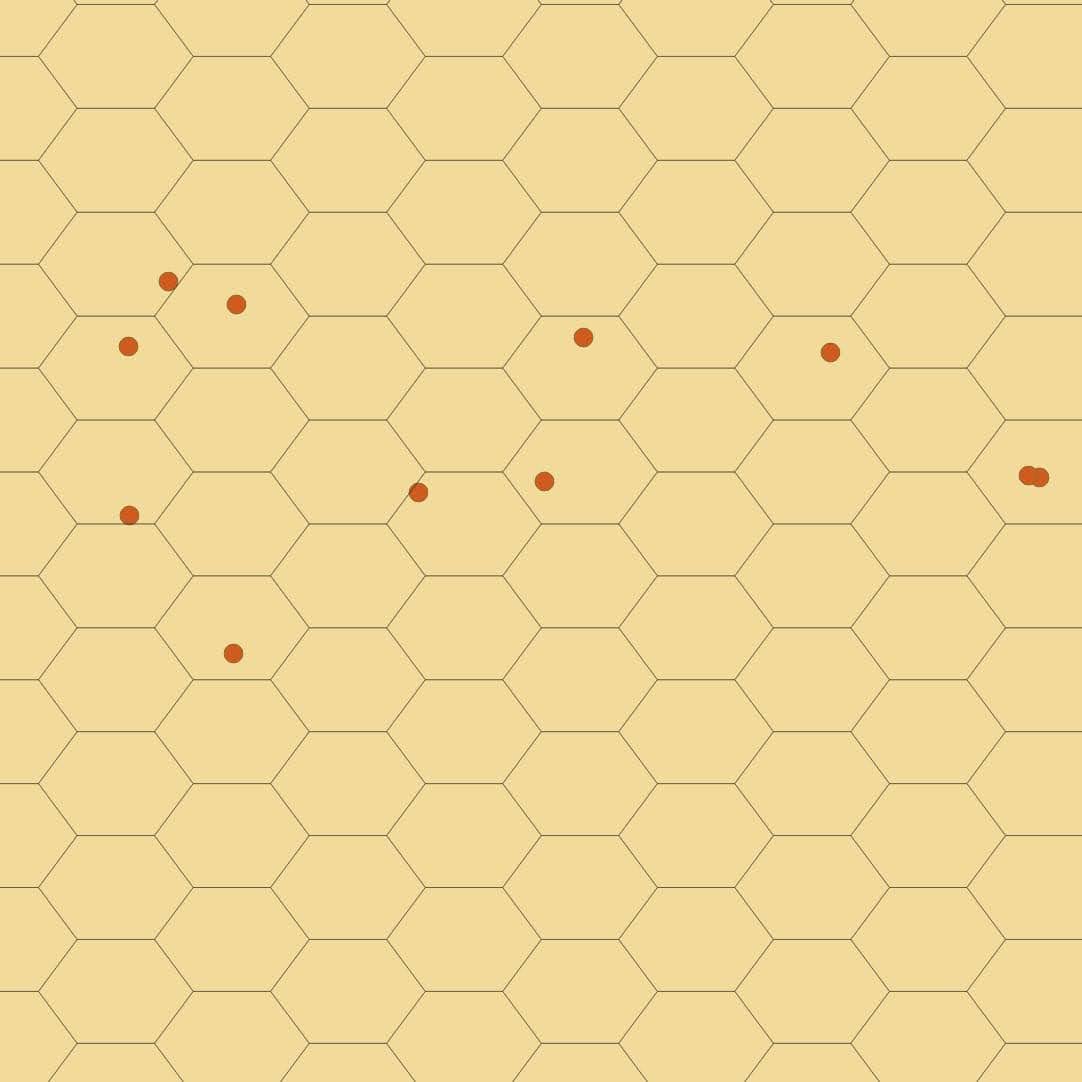
To bring them all together, we can use a hex grid of the city that has a resolution of approximately a one-block scale, exactly the kind that's generated as part of calculating "Walk Potential".
Here are a range of other metrics that can be added for every cell in hex grid if you have the metrics available. These are all packaged for easier use in the Sidewalk Priority Toolkit, a plugin for the QGIS app.
Max Street Volume, Width or Speed
Given road centerlines with data attached, such Average Annual Daily Trip data (AADT), speed or width: calculate the max AADT throughout the city.
For each hex cell:
- Find all the streets that intersect the cell
- Calculate max AADT for intersecting street.
- Scale from to 100.
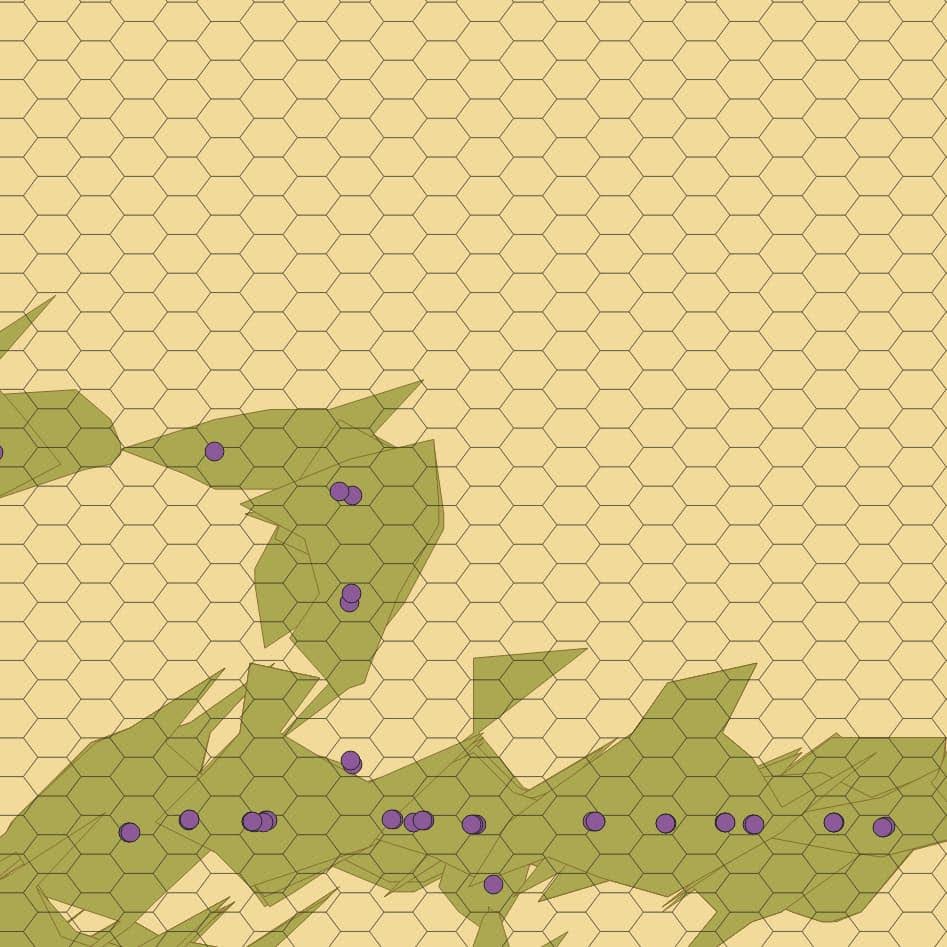
Missing Sidewalk Distance or Sidewalk Condition
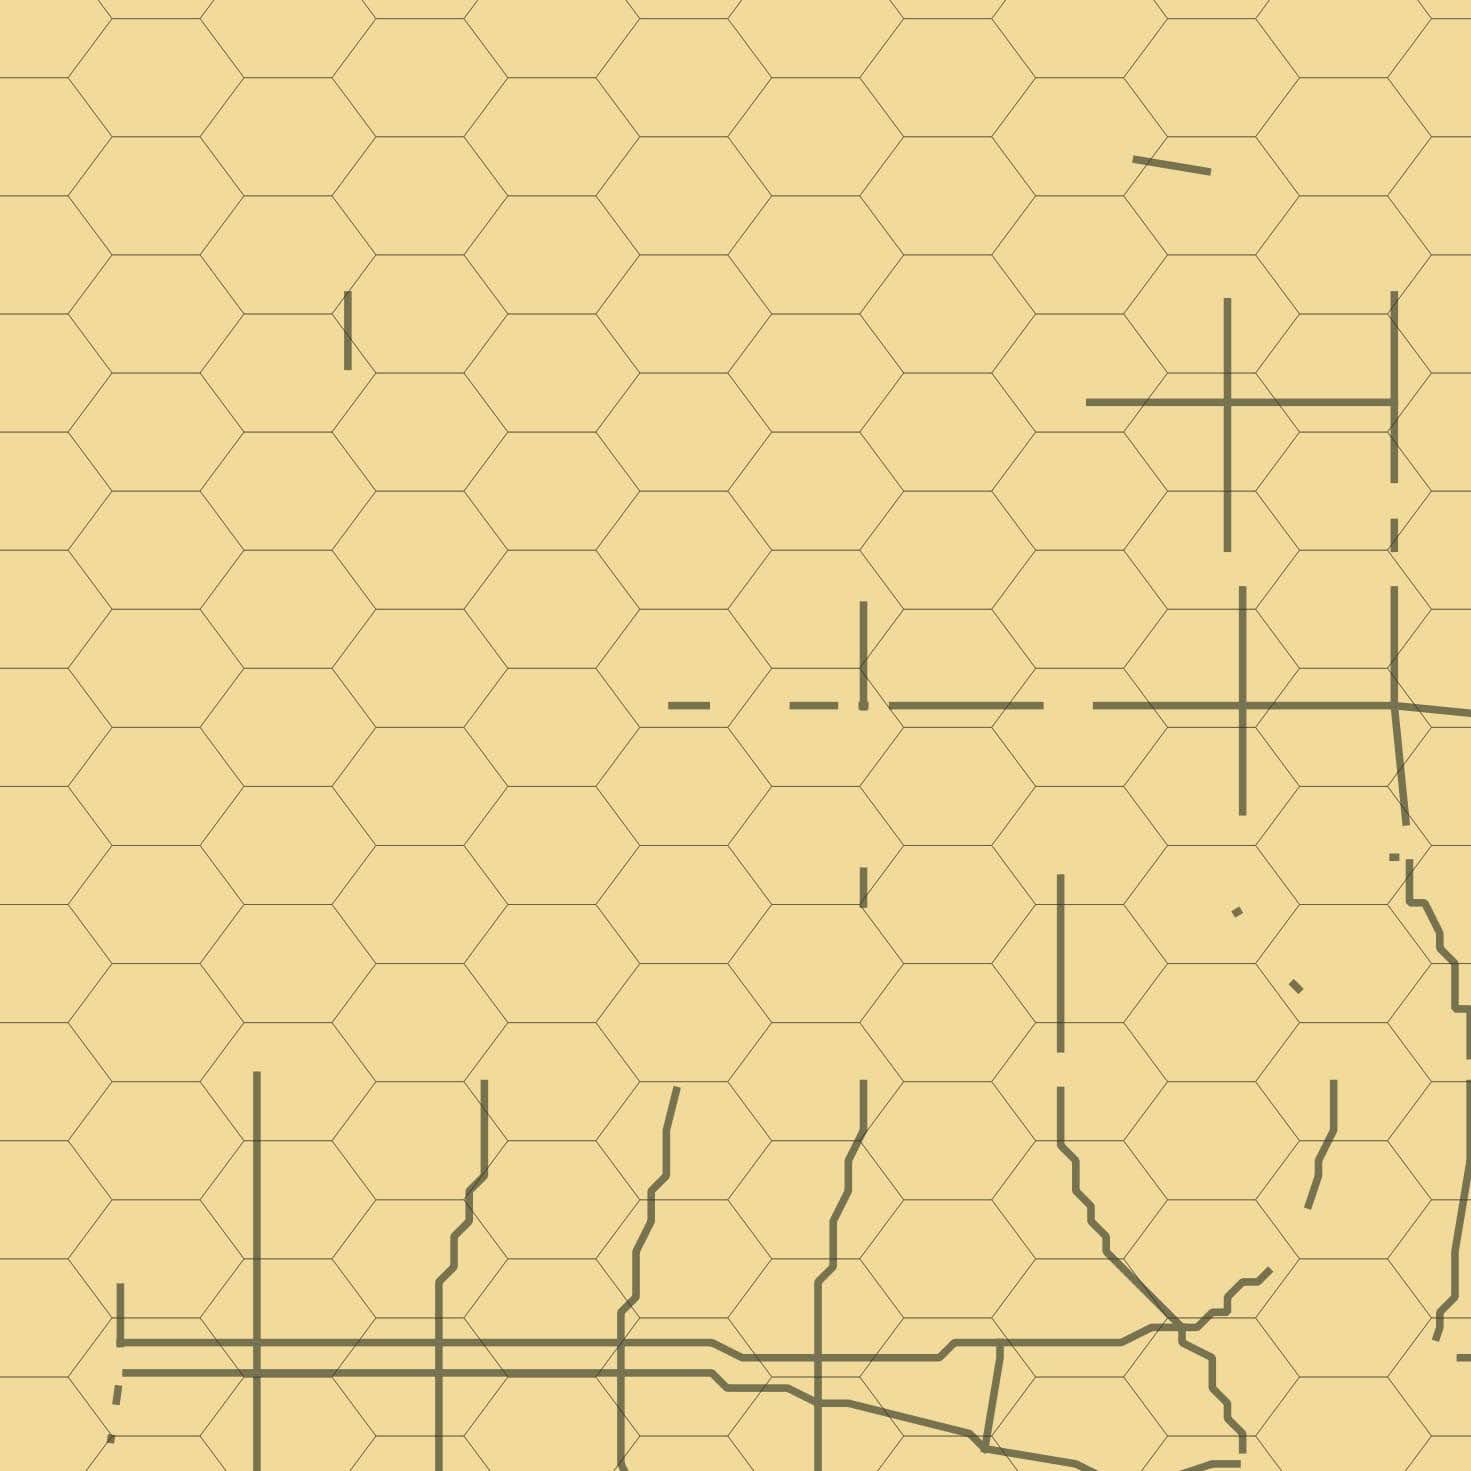
For each hex cell:
- If the cell completely contains a missing sidewalk section, add it to the hex's missing length.
- If the missing sidewalk intersects with the cell,
- check if the center if the segment is within the hex
- IF so, assign the length to that hex.
Similar logic could be used for considering the sidewalk condition as well. Like this:
Given files with missing sidewalk data and sidewalk condition data:
For each hex:
- Score 0 if contains good/fair condition sidewalks
- Score 50 if contains poor condition sidewalks
- Score 100 if sidewalks are missing
(Higher score = higher priority to fund sidewalks)
You might also wish to calculate something like the "Top 5 miles of highest priority sidewalks". After you have calculated the final priority for each hex cell you can take this steps to calculate it:
Sort hex cells from highest priority to lowest.
For each hex:
- Add their missing sidewalk distance to the running total.
- Check if the running total so far exceeds 5 miles.
- If not, continue.
Traffic calming, bike/ped crashes and other point data
You may wish to factor in data with a point geometry as well, such as assigning lower priority to locations that are already traffic calmed or assigning higher priority to locations with more pedestrian-involved crashes.
Example: Streets without traffic-calming may be higher priority to receive sidewalks. Given a collection of points with traffic-calmed locations, for each cell in a hex grid:
- If there's a traffic-calmed location within the hex, add a traffic-calming point to the cell.
- Calculate score from 1 to 100 so less traffic-calming scores higher.
Example: Given a collection of points with crash locations, for each cell in a hex grid:
- Count the number of crashes in each hex.
- Scale the crashes from 0-100.
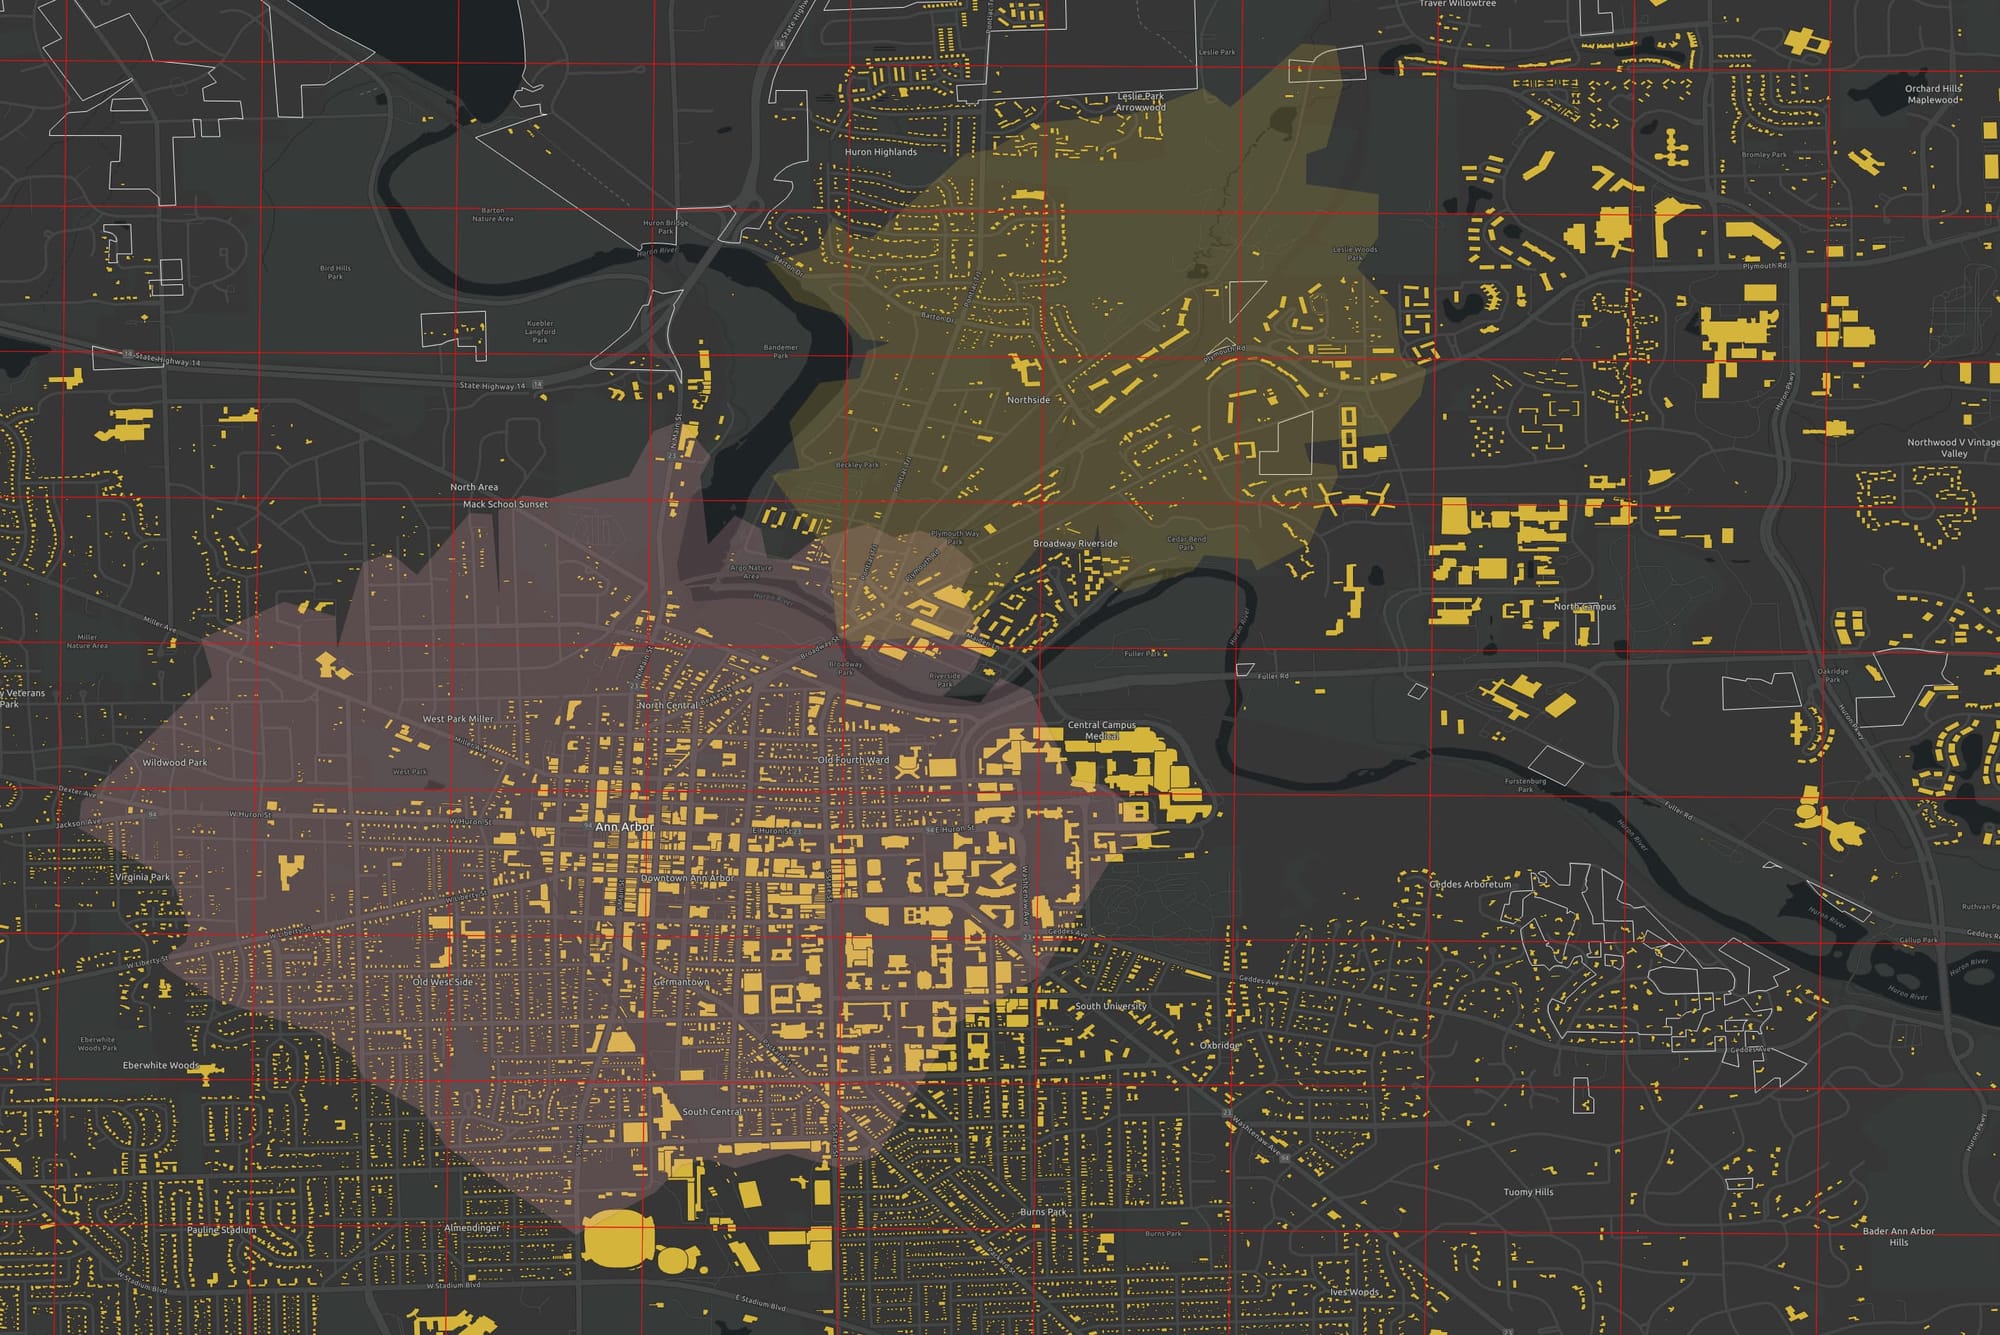
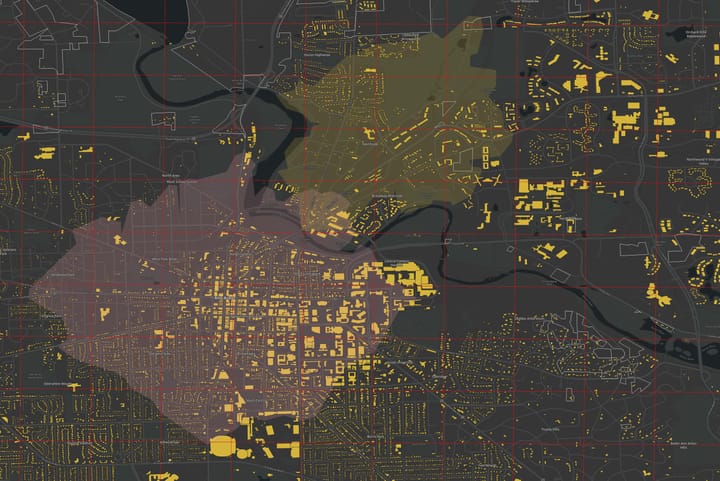
Transit potential and other proximity calculations
Sidewalks near transit stops makes the transit service more effective, safe and welcoming. This metric was one that Bloomington ended up using to help find missing sidewalks near bus stops so those connections could be prioritized.
This analysis requires a web service that can generate isochrones, the area with a 5 or 10 minutes walk from a bus stop.
Steps:
- Given a collection of points containing bus stop points, generate 5 and 10-minute walk isochrones for all the bus stop locations.
- For each hex cell
- If the center of the cell is within the 5-minute isochrone, set transitPotentialScore = 100
- If the center of the cell is within the 10-minute isochrone, set transitPotentialScore = 50
This pattern could be re-used to check for proximity for other types of locations.
Download Sidewalk Location Toolkit
After installing QGIS, you search for and install the Sidewalk Location Toolkit under the Plugins: Install and Manage Plugins... menu item.
Bringing it all together in a sidewalk location priority heatmap
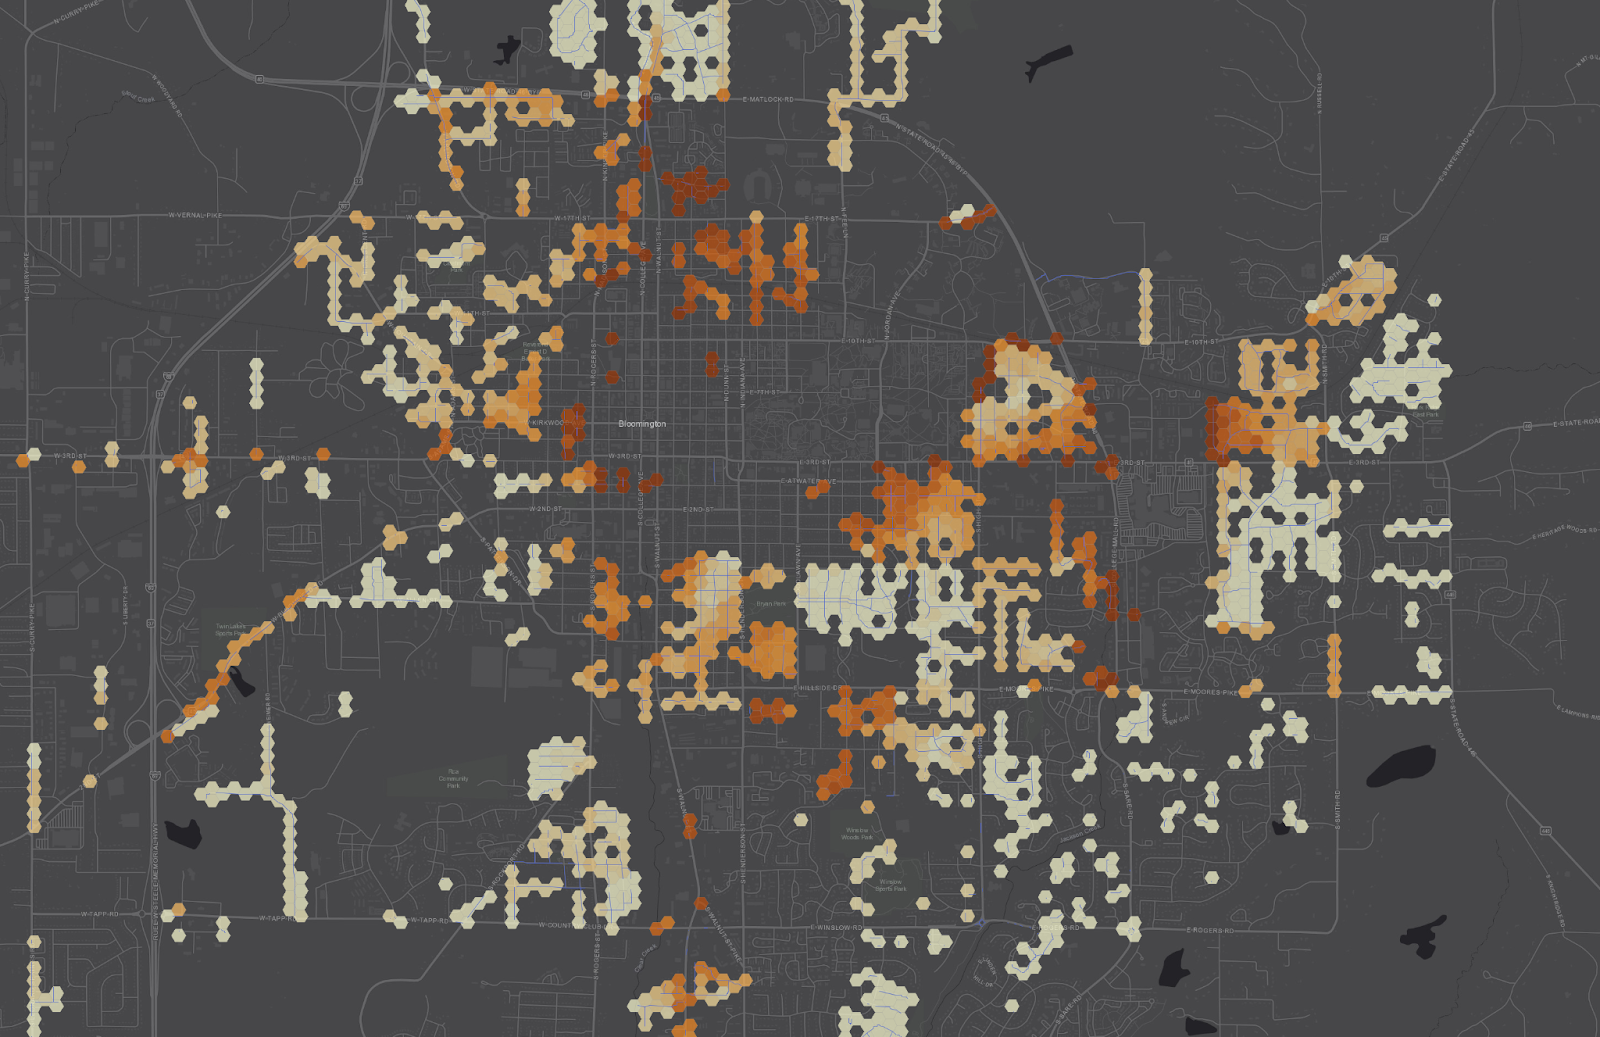
I have post that dives more into bring these variables together and create a final heatmap. For that, see:
Good luck with with your sidewalk planning!
Related Post
Comments ()